District news
Metro District’s GIS Coordinator
By Diana Flores Castillo
Diana Flores Castillo started at MnDOT as Metro District’s GIS Coordinator back in February 2025 working for the Asset Management unit in Metro Maintenance. Before coming to MnDOT, she was working as a GIS Specialist I for the City of Saint Paul in their Water Department (Saint Paul Regional Water Resources (SPRWS)) for two and a half years. And before that, she had a summer internship with Esri as a Solution Engineer Intern after she graduated from the University of Minnesota-Twin Cities in May 2022.
She graduated with a bachelor’s degree (B.S.) in Geography within the GIS track and with a minor in Leadership as well. Throughout her undergraduate years, she was a SEEDS student worker with the Minnesota Department of Transportation and was also an intern with Ramsey County Public Works as well. Additionally, she was a Phoenix Student Intern with the MnDOT Bridge Office as well back in 2017.
Diana is excited to be back at MnDOT and hopes to aid in the GIS efforts of Metro District’s GIS users and to help coordinate informational GIS events as well. She is also excited to learn from others as well in the organization. Currently, some of the projects that she is working on is a customized geoprocessing tool for Metro District Wetlands, collaborating on a revamp of the yearly Congestion map, and coordinating between Metro District truck station on their summer work routes map for maintenance activities.
Understanding GIS Needs Across MnDOT: Your Input is Key
By Lindsey Savage and Ben West
GIS is a critical part of many roles across MnDOT—from those collecting data in the field, to developers building maps and apps, to supervisors managing GIS teams, and staff who rely on GIS products to inform decisions.
To ensure our GIS tools, support, and training meet everyone’s needs, we’re launching a comprehensive survey open to all who use or interact with GIS in any capacity at MnDOT and MNIT@DOT.
The survey results will provide valuable insights into how GIS is currently supporting our work and where there are opportunities to improve. This will help guide future efforts to enhance GIS services, training offerings, and coordination throughout the agency.
We encourage everyone involved with GIS—no matter the role or level of interaction—to participate and share their experiences. By doing so, you’ll help shape a more effective and responsive GIS environment for MnDOT’s future.
The survey will take approximately 5–15 minutes, depending on the questions that apply to you.
Take the survey: https://arcg.is/q1qe80
Thank you for contributing to this important initiative.
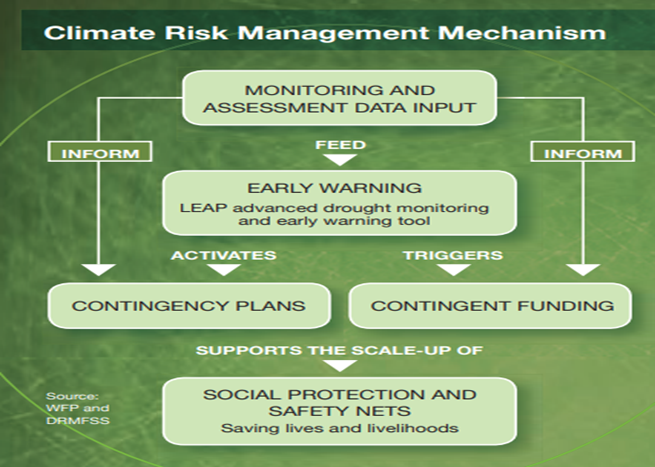
Climate Change - GIS Vital Role in Disaster Risk Management
By Engdawork Kassaye, Geographic Information and Mapping
In Africa, particularly in countries like Ethiopia where millions depend on rain-fed agriculture and pastoralism, climate change is not a distant threat—it’s a daily reality. Increasingly frequent droughts, erratic rainfall, and extreme weather events are severely impacting lives and livelihoods.
In this context, Geographic Information Systems (GIS) play a vital role in Disaster Risk Management (DRM) by enabling both risk monitoring and early action that can save lives. In regions where data collection is challenging and costly-due to diverse agro-ecological conditions, limited rainfall stations, and vast land areas- satellite imagery becomes crucial for monitoring crops and pasturelands. GIS helps reduce the cost of data collection and allows for continuous observation of hard-to-reach areas. 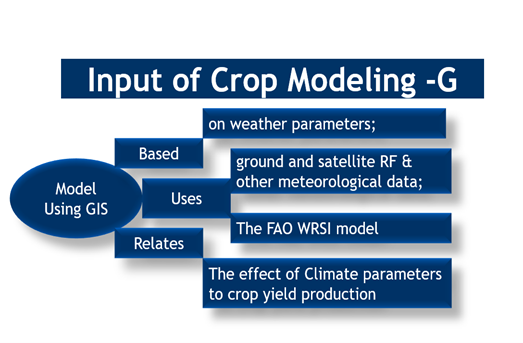
One of the key applications of GIS in Ethiopia is seasonal monitoring. By integrating ground-level agricultural data with satellite imagery - such as rainfall, vegetation indices, and evapotranspiration—analysts can monitor seasonal performance in near real-time. This helps determine whether a growing season is delayed, normal, or early.
In addition, seasonal outlooks are produced using historical agri-meteorological data and climate forecasts from the IGAD Climate Prediction and Applications Centre (ICPAC), part of the WMO network. Analysts compare current climate indicators with similar past years ("analogous years") to predict the likely performance of the season. This forward-looking analysis provides critical early warning, allowing for proactive rather than reactive responses—decisions that affect millions of lives.
Analysts also conduct decadal assessments, triangulating findings with secondary data from various sources and validating them with selective ground-truthing. When indicators point to a poor or shortened season, early action becomes possible. This may include promoting short-cycle crop varieties, enhancing water conservation practices, or pre-positioning emergency supplies.
Moreover, these forecasts can activate risk financing mechanisms such as crop index insurance or contingency funds for rapid emergency response. For vulnerable communities, such interventions can be the difference between resilience and crisis.
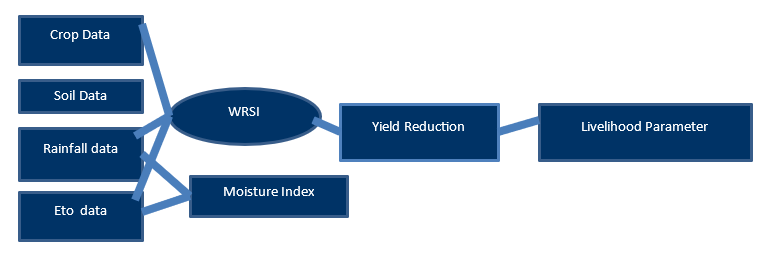
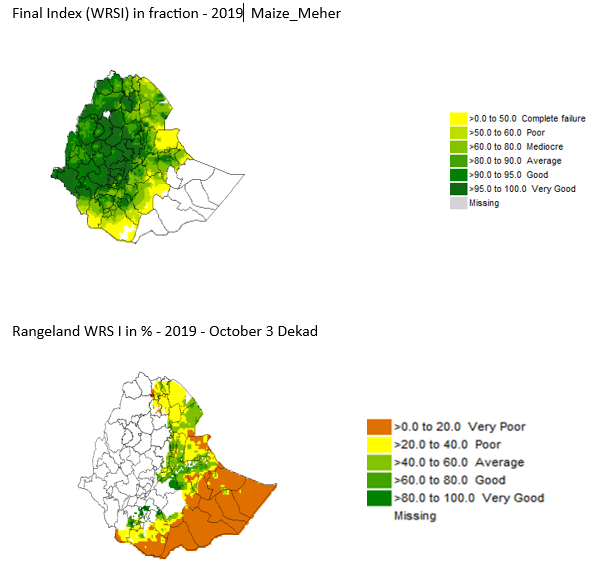
A powerful tool used in this process is the Water Requirement Satisfaction Index (WRSI), which estimates crop water stress by comparing crop water needs with actual water availability throughout the growing season. High stress levels, detected early through GIS models, can indicate potential yield losses before harvest—supporting timely food security decisions and emergency planning.
As climate change continues to intensify, Ethiopia faces more frequent agro-meteorological (droughts, seasonal failures) and hydrological disasters (floods, landslides). GIS empowers decision-makers to map risk zones, forecast impacts, and prioritize responses based on exposure and vulnerability.
Ultimately, GIS is more than just a technology—it is a life-saving tool. By transforming complex data into actionable insights, it enables timely, informed, and targeted responses to growing climate risks and helps protect the livelihoods of millions.
|

Sustainability & Public Health at MnDOT
By Jacki Anderson, Sustainability & Public Health in Minnesota
The Office of Sustainability & Public Health (OSPH) addresses climate change and public health disparities in the transportation system. OSPH can utilize GIS for several initiatives including carbon reduction, resilience planning, and public health integration. The work of OSPH aligns with MnDOT's Strategic Plan. Jacki Anderson is giving a presentation for the GIS Steering Committee led by Darren Laesch and Amy Harrigan.
Webinars:
August 19, 2025: Webinar: Minnesota Electric Vehicle Infrastructure Needs Assessment
|
Technology update
By Andrew Kurth, GIS Analyst
GIS Bytes
See Outlook reminders for September & October 2025.
Trivia
1. Ed Pauls built a static cross country skiing machine in his Chaska, Minnesota garage to train for a race back in the 1970s. What is the exercise equipment company?
2. What coffee house chain was founded in Edina, Minnesota?
3. Who wrote 'Starfish and Coffee'?
 Minnesota Veterans Building
MnDOT GIS Newsletter Team
Amy Sanda (Editor) – OTSM
Bob Wolbeck - OTSM
Hol Flor - OTSM
Jacki Anderson, OSPH, Jacki.Anderson@state.mn.us
Diana Flores Castillo, Metro District, Diana.FloresCastillo@state.mn.us
Engdawork Kassaye, Engdawork.Kassaye@state.mn.us
Andrew Kurth, Office of Environmental Stewardship, andrew.kurth@state.mn.us
Lindsey Savage, Lindsey.Savage@state.mn.us
Ben West, Benjamin.M.West@state.mn.us
| Back to top |

|