WHAF FAQS
That acronym might make you think of a tough game of Scrabble; but it actually refers to some frequently asked questions about watershed health. Most inquiries fall into a few topic areas that cover both 'how to' questions and 'so what' questions. Read on for the answers to some common questions.
TOPIC: Climate data and reports
Climate FAQ – What is a Watershed Climate Summary?
The Watershed Climate Summary is a report that summarizes climate information for each major watershed in Minnesota. The report covers observed patterns and trends in precipitation and temperature records based on data collected from 1895 to 2018.
Climate FAQ - Where do I find my Watershed Climate Report?
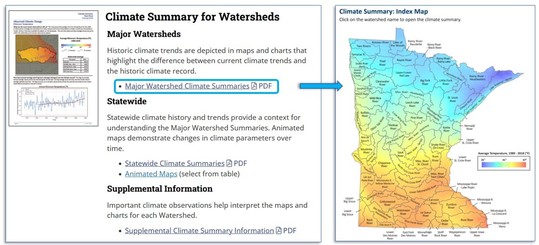
Option 1: Open the WHAF Watershed Report page. Scroll to the bottom and click on the link to the Major Watershed Climate Summaries. This opens a statewide map and you can click on any watershed to download the report.
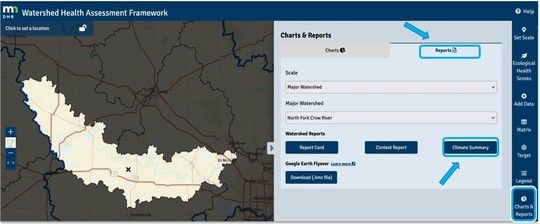
Option 2: You can open the report while using the WHAF Map. Click on the map to set your location. Click on the Charts and Reports tool to open the panel. Select the Reports tab at the top, then click the Climate Summary button.
 Either method will download and open the pdf of the Watershed Climate Report for your major watershed of interest.
Climate FAQ - What does my Watershed Climate Report tell me?
Each climate summary uses historic precipitation and temperature data to create watershed specific summaries of patterns and trends.
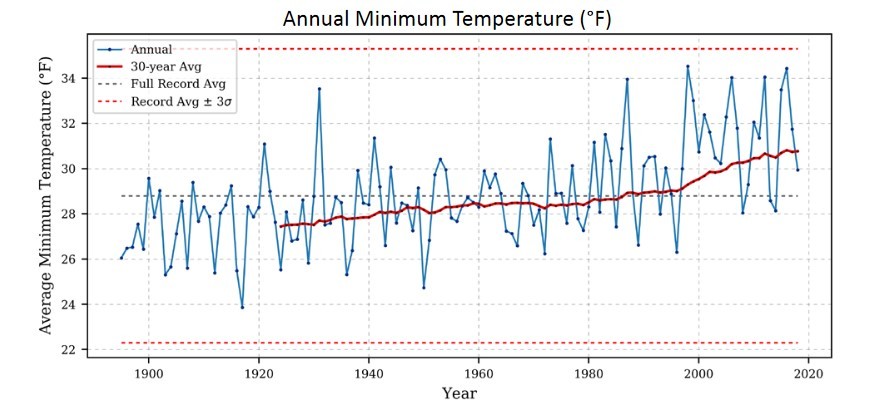
The example below is for the Pine River Watershed in north central Minnesota. This chart shows the Annual Minimum Temperature using data from 1890 to 2018. The blue line reveals the variability in the annual average minimum temperature while the red line shows the 30-year moving average, revealing a rise in the average minimum temperature over time. These results are consistent with the statewide trend of warmer winters in Minnesota, particularly warmer winter nights.
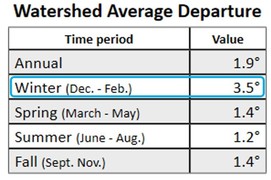
 There are also summary tables that show the degree of departure for the most recent 30 years compared to the long-term climate record. In the Pine River Watershed, the Annual Minimum Temperature for recent winters is 3.5 degrees warmer then the long-term average.
Minimum Temperature Departure - Recent 30 years compared to entire climate record
These examples show how each Watershed Climate Summary uses historic climate data to summarize annual averages, long-term trends and departures over time.
To support our users, we also deliver a Climate Supplement that will help you interpret the Climate Summary for your watershed.
Climate FAQ - Can I see how climate has changed across all of Minnesota?
We deliver three different climate products at the statewide scale:
When you open the WHAF Map of statewide climate data, click the Add Data tool to view the climate data. Toggle each layer on and off to see it display in the map. Data layers include a recent 30-year average for precipitation and temperature, as well as data that shows where the most recent 30 years has 'departed' the most from the historic climate data.
TOPIC: Health Scores and Watershed Boundaries
Health Score FAQ – What do the colors and values mean for the different health scores?
The watershed health scores are on a red to green, 0 to 100 scale. A low value indicates the presence of a health concern or a high level of risk. A high value indicates the absence of a particular health concern or a low level of risk.
Some scores are calculated to the scale of an entire major watershed, and some are calculated so each of Minnesota’s 10,000 catchments (refined HUC 12) receive a score. In either case, the scores are calculated for all of Minnesota so you can compare results for the entire state. More about Using Watershed Health Scores can be found on our website.
Health Score FAQ - How do I decide which health scores to explore in my watershed?
It can be overwhelming to work through the whole suite of health scores in the WHAF. One way to get a quick snapshot of your watershed scores is to use the sortable Matrix Tool in the map. This tool summarizes the catchment scale health scores in one table by calculating an average value at each watershed scale for the location you set in the map.
- Catchment - health score for the local catchment watershed you selected.
- Upstream - average health score for catchments that send surface water flow to your location (true upstream watershed). Tip: For 'headwater' catchments, the catchment scores and the upstream scores will be identical because they both refer to the score for a single catchment found at the 'top' of its watershed.
- Major - average health score for catchments within your major watershed boundary
- Basin - average health score for all catchments within the entire major river basin that holds your location.
The image below shows the nested watershed boundaries used to summarize the health scores in the Matrix table for the Cannon River.
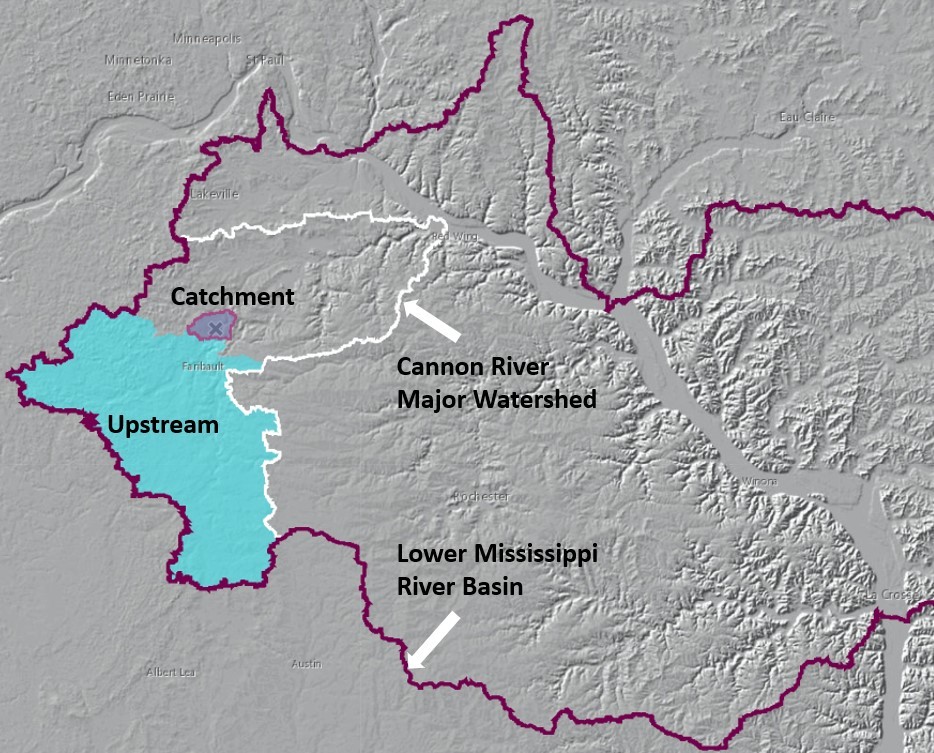
Once you open the table, you can sort the scores from high to low, or download the table to review it as a spreadsheet.
This example from the Cannon River Watershed focuses on scores that fall below 40. It is worth noting that not all health scores in the WHAF are represented in the matrix table. Some health scores are only calculated at the major watershed scale and are not comparable at the catchment scale.
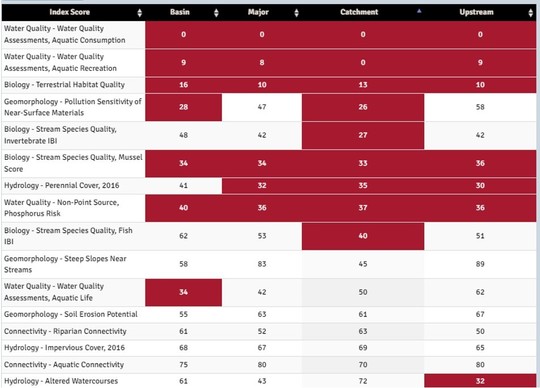
Health Score FAQ - What do I look for in the Matrix table to help me focus my efforts?
The table can help point you to conditions of concern (low scores) or quality conditions (high scores). Remember that scores use a statewide scale that compares watershed health across Minnesota. Each landscape setting is unique so a 'high' score in a disturbed setting may be 'low' score in a more pristine location. Your local knowledge will help you decide where you should dig deeper and investigate.
Here are some patterns to look for:
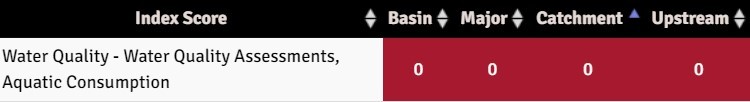 Some low scores occur at all scales (catchment, upstream watershed, major watershed, and river basin). This indicates a condition that might need to be addressed at a broad landscape scale. In this case, Assessments for Aquatic Consumption receives a '0' at all scales. This score reflects consumption advisories for mercury in fish tissue, the result of airborne contaminants from regional powerplants. This issue cannot be addressed locally, but would require a broad policy approach. Even though you cannot easily impact this condition, it still impacts the health of the aquatic and human communities in your watershed.
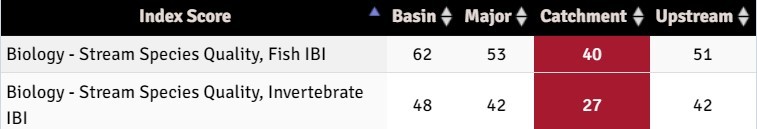 In contrast, the Invertebrate and Fish IBI (index of biotic integrity) scores are somewhat lower at the catchment scale, suggesting degraded stream health for the local aquatic community. This might be addressed by assessing conditions and risk factors that influence stream health at this location.
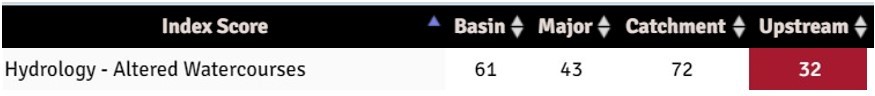 Altered Watercourses is a score lowest at the 'upstream' scale. This watershed condition refers to stream miles that have been straightened or changed. This would impact the quantity and quality of the water that arrives at your location. This upstream condition should be assessed before working at the local scale.
That's a brief example of using the Matrix table to review WHAF Health Scores. Remember to look at all of the watershed scales as you hunt for relationships that might help you identify the scale of an issue. That's the first step toward finding solutions that address the right problem at the right scale.
Keep those questions coming, that's how we get better at what we do. Email WHAF staff at: WHAF.DNR@state.mn.us
We look forward to hearing from you!
|