NEW DATA added to the WHAF
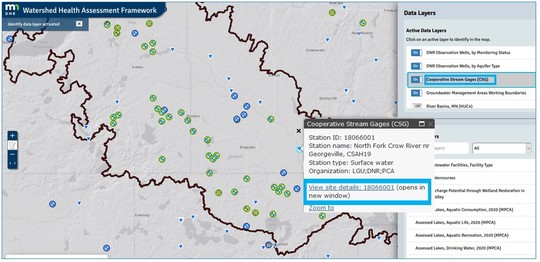
Stream gages and observation wells are now accessible in the WHAF map. Click a symbol for the hyperlink to the gage.
Cooperative Stream Gages (CSG) and DNR Observation Wells
A great way to access and explore the DNR Observation Well data and the Cooperative Stream Gages data is with the Watershed Health Assessment Framework web application!
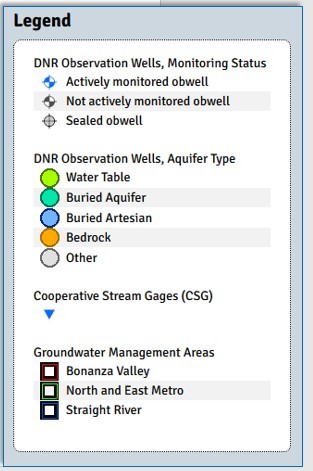
DNR Observation Wells are symbolized by aquifer type and monitoring status. The Cooperative Stream Gages are all the same symbol.
- Open the WHAF online mapping application (You can use this link to go directly to the Bonanza Valley Groundwater Management Area shown above).
- Select the Add Data tool (in the right hand menu system) to load the layer(s)
- In the Active Data Layers list, select the layer name to activate the identify tool.
- Select a site in the map to view the attribute pop up window.
- Within the pop up, use the link to view site details, reports and data including water level measurements.
|
How is the stream gage and well data being used?
Delivering data with context for Bonanza Valley
Groundwater users in the DNR’s Bonanza Valley Groundwater Management Area have been working together to understand the ways that groundwater and surface water are connected. When they asked for an easier way to access data and information such as stream gages and observation wells, Mark Hauck with the MNDNR thought a data portal in the WHAF online map would be the best vehicle to meet the need.
Mark knew that the WHAF had already proven to be an effective tool to display the Bonanza Valley GWMA boundary with groundwater data to create maps. He contacted WHAF staff and they worked together to meet this new need.
'These new layers connect users with existing groundwater and stream flow data sets managed by DNR and MPCA in a way that adds quick access to highlights of both groundwater and surface water in a single view. For those who want to dig deeper at a particular station, users can hyperlink to the existing web pages for Cooperative Stream Gaging and Cooperative Groundwater Monitoring for site maps, hydrographs and downloadable data sets. Integrating data on a common platform allows the public to see data and information in new ways.' Mark Hauck, MNDNR EWR North District Planner, Central Region
Gage data connects time and place; stream flow and land cover
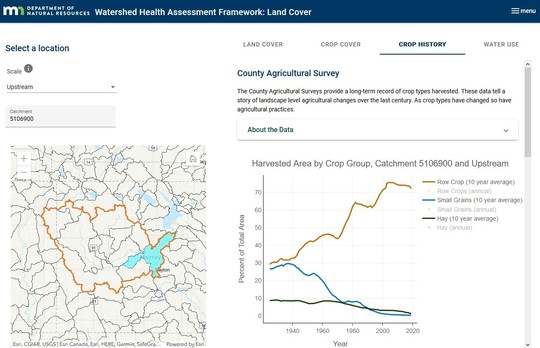
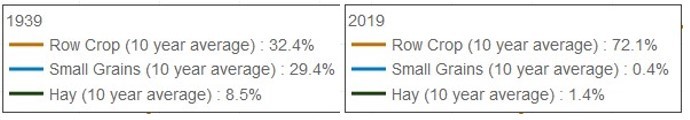
Another connection is being made by hydrologists that study gage data together with land cover. Of particular interest is how changes in the stream flow patterns may connect to changes in the types of crops that are being grown. The WHAF Land Cover application includes the charts of historic cropping patterns beginning in the 1920's. By connecting the stream gage location to the upstream charts, the changes in the pattern of stream flow and shifts in crop cover can be investigated.
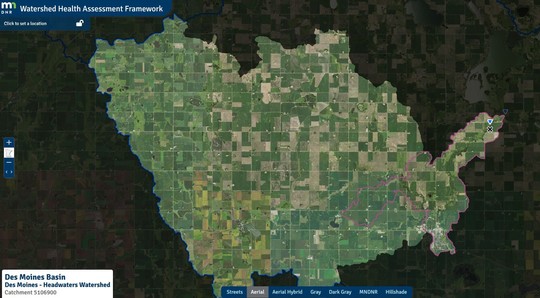
This masked area is the part of the watershed that is upstream of the stream gage (blue triangle)
Using the Land Cover application, you can view the different types of vegetation covering this entire upstream area. You can also look back and see how the crop history has changed over time.
Open Charts and Reports to view Crop History for this upstream area (1920 - 2019)
Hover over the chart to display this yearly summary of the distribution of crop types.
Connecting the history of land cover change with the stream gage record is an important way to grow our understanding of how our land and water resources interact and influence each other over time.
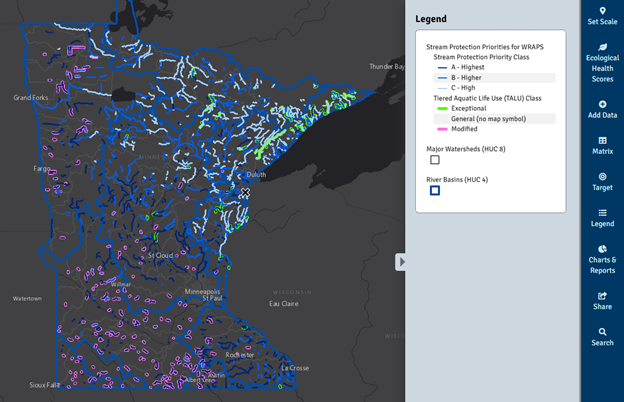
Stream Protection Priorities - 2021
Restoring impaired waters is expensive, difficult, and may require a long time frame for success. Protecting streams and rivers that are currently healthy is far more cost-effective than restoring lost health and function.
To help streamline that work, the MPCA and DNR data analysts work together each year to update the Stream Protection Priorities data layer in the WHAF Map.
This data is available through DNR Quick Layers or the Geospatial Commons.
View the Stream Protection Priorities in WHAF.
How do Stream Protection Priorities help us better manage stream health?
The Stream Protection Priorities data ranks streams that are currently meeting water quality standards for aquatic life. The protection priority rank is based on the likelihood of a stream becoming impaired in the future. A stream that is close to impairment will have a higher priority, and stream that is less likely to become impaired will have a lower rank.
The stream protection priorities include the level of risk posed from near shore areas, the contributing watershed, and the level of protection already in place in the watershed. The rankings can be used to select actions that are targeted toward conditions that create the greatest risk. Because the Stream Protection Priorities utilize state-wide coverages, additional local information should also be included such as forest management practices, potential development trends and mining impacts.
Learn more about how rankings are determined.
|
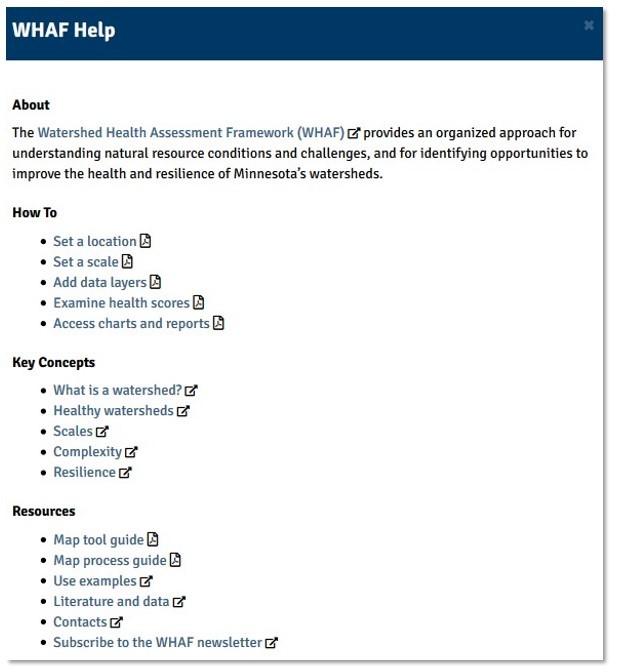
Need a Little Help?
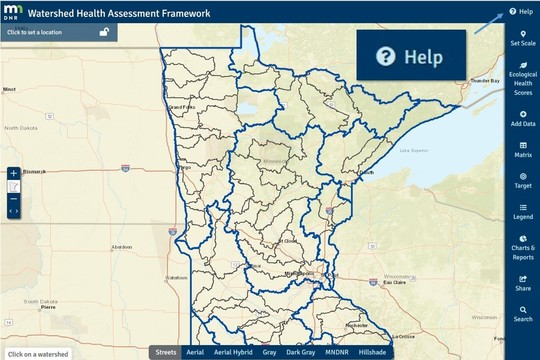 The new help menu brings a wealth of resources into our mapping environment. Now you can find use tips, key concepts, and resources in one location!
The help menu offers a list of resources that open in a new window in your browser.
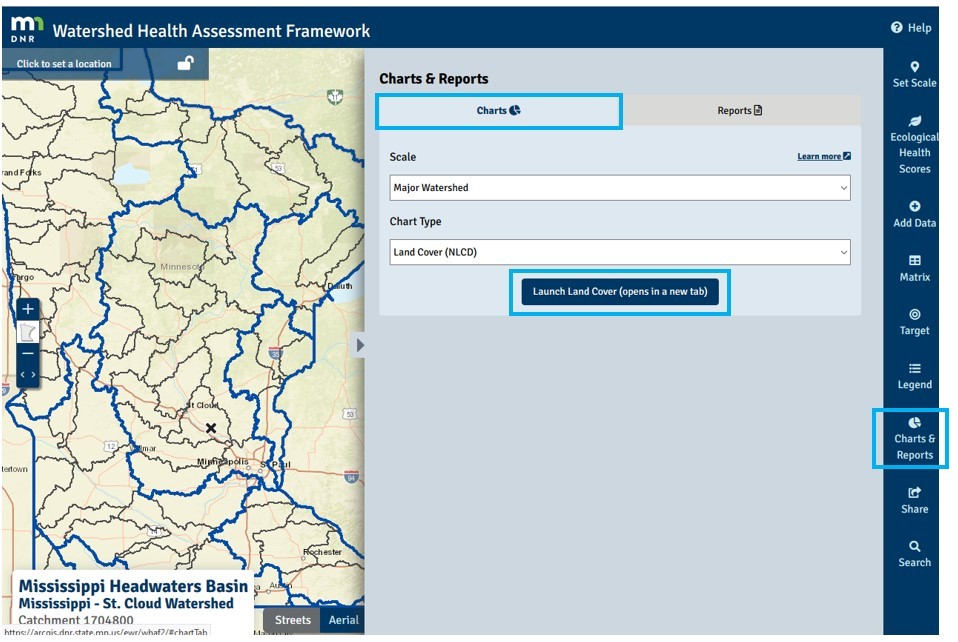
Charts & Reports - Use Tip
You may have noticed another change to the map toolset. There have been some changes to the 'Charts and Reports' panel.
The Charts and Reports panel will open with the Charts tab active and a link to the new Land Cover Application
Land Cover Application
When that panel opens, the Charts tab is highlighted at the top and it includes a direct link to the Land Cover Application. If your location is set in the map, you can select your Scale and Chart Type before you launch the Land Cover App.
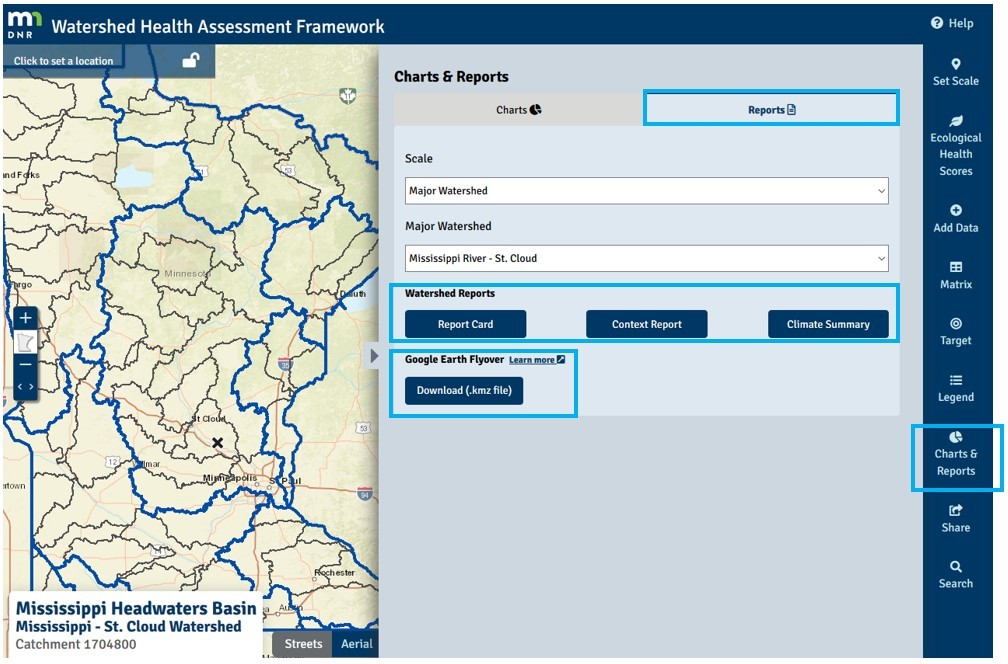
Watershed Reports and Google Earth Fly-Over
Switching to the 'Reports' tab will give access to reports for your selected major watershed.
If you switch to the Reports tab at the top of the panel, you will find the familiar list of Major Watershed Reports for the location you have selected in the map, including:
- Report Card
- Context Report
- Climate Summary
To play a fly-over of the major river in your watershed in Google Earth, download the file and follow the instructions found here.
Check back often
Working with our partners, the WHAF continues to add data and tools to help us learn more about Minnesota's watersheds. Check back often for new information and reach out anytime with comments and questions using the email below.
|