|
Feb. 24, 2020
Basic Floodplain and Shoreland Workshops
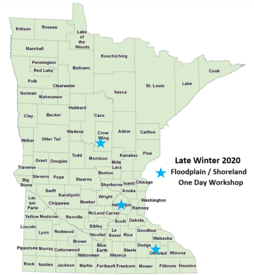
A one day workshop covering floodplain and shoreland basic and advanced topics is being offered at the sites listed below. Two tracks are offered.
Cost: Free!
Feb. 25, 2020 (Tue), 8:45 am – 4 pm, Minnetonka Community Center
Feb. 27, 2020 (Thu), 8:45 am – 4 pm,Crow Wing County Land Services Office, Brainerd
March 4, 2020 (Wed), 8:45 am – 4 pm,Fire Station #2, Rochester
|
Contact Ceil Strauss, 651-259-5713 or floodplain.dnr@state.mn.us for more details on topics to be covered or to RSVP for a training.
MDNR will be updating the Floodplain Training and Education page as we get upcoming trainings confirmed.
By Ceil Strauss, DNR, State Floodplain Manager
Based on the wet 2019 for Minnesota - and the wet fall in much of the state - the probability of spring flooding is high in many areas of the state.
See National Weather Service (NWS) forecast for flooding
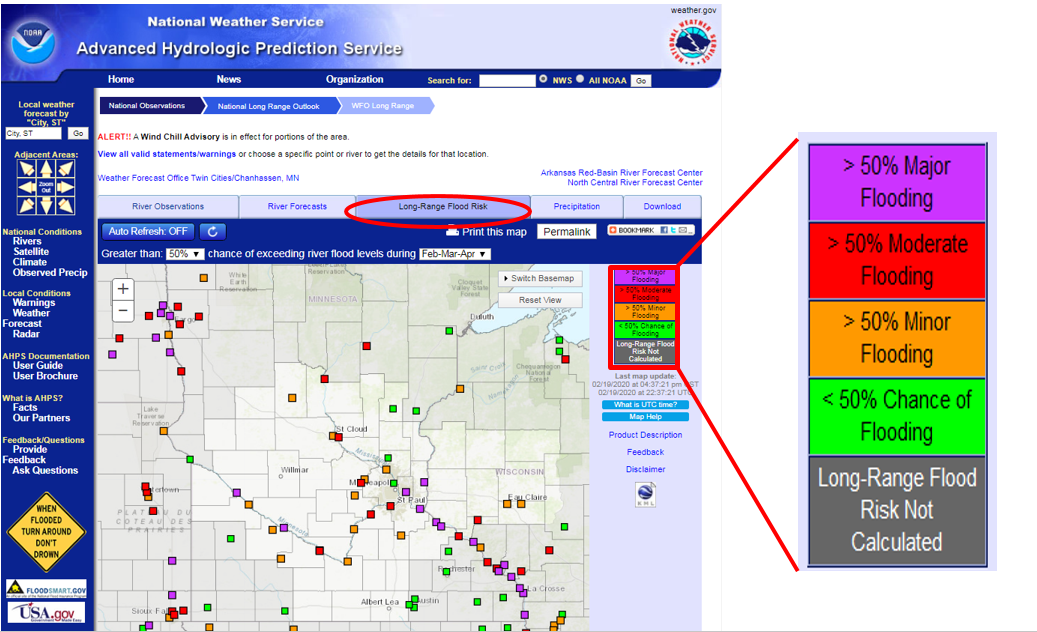
The map below is from the NWS Advanced Hydrologic Prediction Service (AHPS) site for central and south central Minnesota. (Select the "Long-Range Flood Risk" tab to see this view.) River gages with purple squares have a greater than 50 percent likelihood of major flooding.
Note that the Major, Moderate and Minor Flooding triggers are based on the damages and disruption seen at those river levels. Those triggers are not the same as the "100-year" or "500-year" flood elevations; major flooding can occur at elevations above or below the "100-year" flood elevations used for regulatory purposes.
See more details for each gage
To see more detailed information, select a gage site. If you look at the "Probability information" tab, information similar to that shown below for the Mississippi River at St. Paul can be seen. The blue circles on the graph show the historical peaks for many years of records. The black triangles show what the peak river levels could be depending on how fast spring melting occurs and how much precipitation occurs. If it melts quickly and we have heavy rain at the same time, the levels will be higher. The red arrow shows that - based on conditions as of Feb. 17, 2020 - there is a >75% chance of major flooding in St. Paul between Feb. 17 and May 17, 2020.

Note that in 2019 there were forecasts for high probability of spring flooding in many parts of Minnesota. While river levels stayed above flood stage for record lengths of time at many gages (including this St. Paul site), a "perfect melt" of warm days and dropping below freezing at night prevented more major flooding and damage.
At MDNR's Flood Preparation, Response and Recover page see links to more NWS gage sites and to the Cooperative Stream Gaging Program page with many more gage sites supported by MDNR and Minnesota Pollution Control Agency (MPCA).
By Ceil Strauss, DNR, State Floodplain Manager (with information from ASFPM release notice)
ASFPM Releases Updated Report
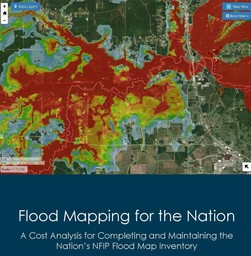
The Association of State Floodplain Managers (ASFPM) prepared the original Flood Mapping for the Nation report in 2013. While the 2013 report provided valuable information for federal and state officials, and legislators and their staff, an update was needed. The newly released report has updated information and helpful tables and graphs.
|
Report Highlights
Since 1969, the US has invested $6.6 billion ($10.6 billion in 2019 dollars) in flood hazard mapping, resulting in nearly $22 billion in losses avoided.
But the work is far from over. Flood Mapping for the Nation provides a cost analysis for completing and maintaining the nation's NFIP flood map inventory.
In its Flood Mapping for the Nation report, ASFPM estimates the cost to complete flood mapping in the US at $3.2 billion to $11.8 billion. The steady-state cost to then maintain accurate and up-to-date flood maps ranges from $107 million to $480 million annually.
Floods are the leading cause of natural disaster losses in the US, and more than half of American voters are personally impacted by flooding. Without complete or accurate flood maps, local officials face serious difficulties in guiding development away from the most hazardous areas or ensuring that development is properly built to protect lives and property.
Floodplain mapping is a sound investment that saves lives, reduces flood losses, and keeps communities thriving, all at a 2-to-1 cost benefit for taxpayers.
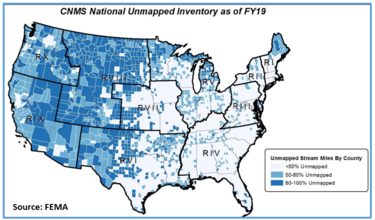
Only 1/3 of the nation's streams have currently been mapped
 |
|
One of the areas where there is much work to be done can be seen in the map to the left. Many streams have not had the flood risk mapped, especially in the western half of the country.
|
Many Maps are Old
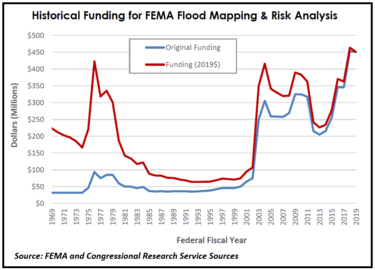
Another challenge noted in the report is that many communities have old maps. In the funding graph (to the right) it can be seen that funding to update flood mapping and risk analysis has gone through cycles.
The value of updated data on flood risk is understood by many decision makers at the local, state and federal levels, and the funding support to provide that information has been an increasing priority in more recent year.
The graph below shows many communities have maps older than five years, the often cited preferred maximum age. And many of the maps in the 25 to 40 year range are for Minnesota communities.
|
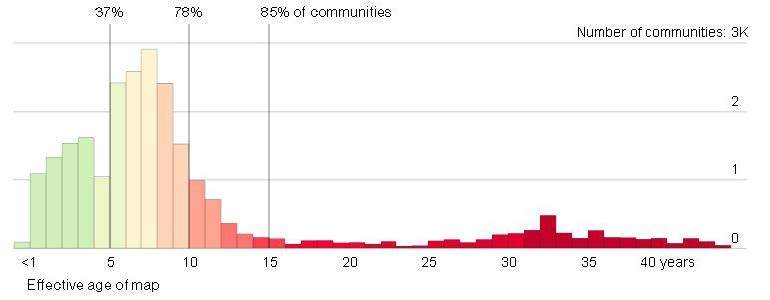
Source: • Bloomberg News. (2017). Outdated and Unreliable: FEMA’s Faulty Flood Maps Put Homeowners at Risk. New York, New York. Retrieved from https://www.bloomberg.com/graphics/2017-fema-faulty-flood-maps/
To see more about these mapping details in much more depth - Download the report
By Matt Bauman, DNR Floodplain and Shoreland Planner
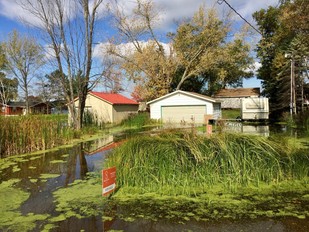
Lake Shamineau and Crookneck Lakes, like many others around the state, are seeing historic high water levels. These lakes do not have outlets and have been filling up like a bathtub. Waters have been rising over the last couple years with no end in sight. There are many affected property owners on these lakes who are proposing solutions to protect their property. These lakes are not identified on any official FEMA floodplain map, and are only guided by the provisions in the community’s shoreland ordinance. To guide the activities around these lakes, Morrison County chose to adopt a special overlay district that allows certain protective measures, while minimizing the environmental impacts associated with alterations of actively eroding near-shore areas.

For the most part, this special purpose ordinance makes it easier for property owners to raise or relocate their home. In many cases, raising these structures to get their lowest floor 3 feet above the highest known flood elevation would raise the total structure height above the 25 foot limit imposed by the shoreland ordinance – requiring a height variance. Morrison County worked with the DNR on a flexibility agreement to eliminate the need for height variances to streamline mitigation. Under the conditions imposed by the permit, the applicant would be required to establish a native buffer along the shoreline equal to 15 feet per foot of height that the principal structure exceeds 25 feet.
In addition, the county is trying to disincentivize the raising of a home on fill. Raising a house on fill requires significant earth moving, can lead to runoff onto neighboring lots, and results in vegetation clearing on lands that are already actively eroding. This special district ordinance would only allow raising a structure on fill if it’s at least 50 feet from the OHWL. All other structures would be required to minimize the disturbed area and raise their home using methods alternative to fill (e.g. on a filled stem wall, or with floodproofing methods to accommodate a first floor designed to internally flood).
|
In addition, the ordinance imposes special filling and land alterations standards. Prior to the establishment of this ordinance, the county had established a limit of 10 cubic yards of filling or land alterations per lot in the shore impact zone. This 10 yard ceiling was eliminated, but requires all land alterations to be designed and guided by an engineer to ensure:
- Runoff will not negatively impact neighboring properties;
- Erosion control measures will be undertaken; and
- The site will be adequately revegetated.
Future Plans
When adopted, it was the hope of county decision makers that this would be a temporary problem and water levels would eventually recede. As adopted, this ordinance is effective until 12/10/20.
In the meantime, the county is actively working with DNR and Homeland Security Emergency Management (HSEM) to find other solutions and relief options available. This is a story that is playing out all over the state, and this ordinance provides a good foundation for those interested in adopting proactive protective measures.
More information on this higher standard and others can be found on the DNR’s Innovative Shoreland Standards Showcase page.
|
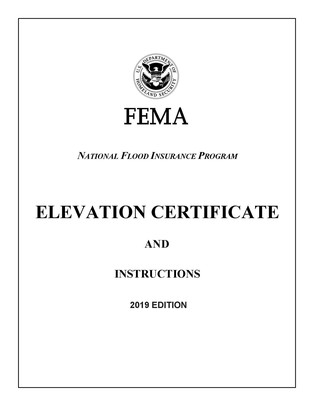
The December 2019 update of the FEMA Elevation Certificate and instructions are now available (as of 2/21/2020) at the FEMA Elevation Certificate download page.
The 2015 Elevation Certificate officially expired 11/30/2018, but its use had been extended until this new updated version was available.
The new form appears very similar to the old form. If the DNR Floodplain program staff become aware of significant changes, those will be highlighted in a future Water Talk issue.
|
A must-read practitioners’ perspective on this emerging threat
Across the United States, urban flooding is becoming more frequent and severe, with increasingly serious impacts to stormwater infrastructure, vulnerable neighborhoods, local and regional economies, and public health. Chronic to extreme, disruptive to catastrophic – urban flooding is rapidly becoming this nation’s number one factor contributing to increased future flood risk. Resilience in the face of this progressively serious problem demands attention and action NOW.
Urban flooding is not new, but it is different than how we experienced it a decade ago. Intensified by sea level rise and changing precipitation patterns, urban flooding is more frequent and intense, with underlying infrastructure designed to handle much smaller flooding events. The water has nowhere to go! As a result, major sectors of our economy are adversely impacted and people living and working in these more densely populated flood-prone areas are at increasing risk.
|
To catalyze attention and action, the Association of State Floodplain Managers (ASFPM) Foundation has published, "Urban Flooding: Moving Towards Resilience. A Summary Report based on the 6th Assembly of the Gilbert F. White National Flood Policy Forum."
The report draws from the wide-ranging discussions that took place during the foundation-sponsored Gilbert F. White National Flood Policy Forum last year, attended by more than 100 experts from local, state, and federal agencies; professional associations and environmental groups; and private sector organizations. It includes examples of time-critical efforts taking place now to prepare for future conditions that could be very different from today.
The report offers practical suggestions for obtaining better data and information, involving vulnerable populations in planning decisions, and exploring funding and financing opportunities to identify and advance solutions. Its summary policy and program recommendations focus on integrated approaches and immediate next steps, including organizing an urban flooding summit in 2021 to address more in-depth the issues and jump-start needed changes.
Please take a few minutes to download and read the report. Then take a few more minutes to think about the role that you, and your agency or organization, could play in further discussions and idea sharing to collaboratively solve this complex problem.
Urban flooding has long been seen as a local issue. But it also needs to become a national priority, and for that matter a global one. ASFPM Foundation is committed to help make it so. We welcome your help as we begin this important journey for a stronger, more resilient future.
Editor's note: This article is reprinted from an ASFPM Foundation notice.
Actual, scheduled, and projected dates since December 2019 Water Talk:
Preliminary Maps
- Goodhue County (panels) - Feb. 10, 2020
- Blue Earth County (panels) - Feb. 2020 (tentative)
- Nicollet County - Feb. 2020 (tentative)
- Pennington County - Mar. 2020 (tentative)
- Olmsted County (panels) - April 2020 (tentative)
- Watonwan County - April 2020 (tentative)
- Le Sueur County - May 2020 (tentative)
- Morrison County - May 2020 (tentative)
- Pope County - May 2020 (tentative)
- Stevens County - May 2020 (tentative)
- Dodge County - June 2020 (tentative)
- Wabasha County - June 2020 (tentative)
- Itasca County - June 2020 (tentative)
- Lake of the Woods County - June (tentative)
- 2020 (anticipated): Carlton, Chippewa, Koochiching, Polk (revised panels), Pipestone (~Dec. 2020), Rock (~Dec. 2020), St. Louis (~ Dec. 2020), Waseca, and Winona Counties
Local Officials Meetings & Open Houses
- Goodhue County (panels) - March 11, 2020
- Rice County (panels) - March 2020 (tentative)
- Olmsted County (panels) - May 2020 (tentative)
- Watonwan County - May 2020 (tentative)
90-Day Appeal Periods
- Red Lake County - Ends April 14, 2020
Letters of Final Determination (LFDs)
- Scott County - March 18, 2020 (anticipated)
- Wright County - March 18, 2020 (anticipated)
- Marshall County - May 2020 (tentative)
- Yellow Medicine County - June 2020 (tentative)
- Red Lake County - Sept. 2020 (tentative)
Effective (6 months after LFD date)
None currently
Additional Map Update Information:
|