|
Dec. 31, 2019
By Ceil Strauss, DNR, State Floodplain Manager
We're hearing about how high the rivers and lakes are - especially for this time of the year - all over the state. Those on land-locked lakes are being hit the hardest, but rivers staying above flood stage are causing excessive bank erosion, and freezing conditions can cause sudden jumps in river levels due to ice jams or frazzle ice.
Considering the excessive amounts of rain we've experienced the past two years, this is not a surprise.
In mid-December, many long-term precipitation gage sites were already showing new annual precipitation records in 2019. See MNDNR Climatology Office's article "Another Very Wet Year in Minnesota" for records broken as of Dec. 20, 2019.
The growing season precipitation ranking figure above shows a large percentage of the state is wetter than 99-percent of the previous years with historical information, and over half the state is wetter than 95-percent of previous years.
|
And much of southern Minnesota also had a very wet 2018, with large areas wetter than 98-percent of previous years and totaling 14 or more inches above average during the year.
Note: See more historical Weekly Precipitation, Departure and Rank Maps. These are prepared April through November by the State Climatology Office.
While we'd prefer to see a drier period and give our water levels a chance to fall, the three-month outlook (below) from the National Oceanic and Atmospheric Administration (NOAA) shows a 40-50 percent probablity of above average precipitation during December, January and Febuary.
|
 Figure: Three-month outlook shows probability of above (or below) normal precipitation during Dec. 2019, Jan. 2020 and Feb. 2020. (Source: NOAA)
By Tania Lopez-Cantu, Carnegie Mellon University Ph.D. Candidate
Editor's note: One of our DNR Floodplain Program staff heard a presentation by Tania and thought the topic would be of interest to many our our readers. This article is adapted from that presentation.
Stormwater infrastructure is necessary to collect, convey, and store runoff when it rains. Existing infrastructure - including stormwater drains, culverts and ponds - was designed by balancing overall infrastructure costs and incurred costs in case of failure. To understand the risk of failure of a single structure, one approach is to examine how frequently an extreme storm that leads to a larger runoff volume than what the structure can hold occurs at the specific location. As an example, a system designed for a 100-year storm can carry more water and has a lower risk of failing due to under-capacity, but is bigger and more expensive. Design engineers use rainfall information from the official precipitation frequency atlas published by the National Oceanic and Atmospheric Administration (NOAA).
Technical Paper 40 (TP40) versus Atlas 14
The first national rainfall atlas for the U.S., the Technical Paper 40 (TP40), was published in 1961.It analyzed station records starting in early 1900 until 1958. The length of the record is important because the longer it is, the more accurately we can estimate the characteristics of a storm that happens infrequently. The TP40 has been widely used to design infrastructure, but is now being replaced by NOAA Atlas 14. Atlas 14 used the same records as TP40, plus 40 to 60 more years of data. The publication of Atlas 14 started in the mid-2000s, and it is still in process. The Atlas 14 including Minnesota was published in 2013. As of today, multiple volumes cover most regions of the U.S. (except the northwestern U.S. and Texas).
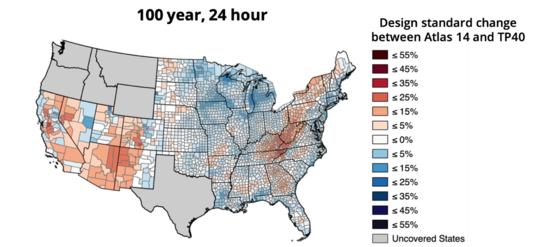 Figure 1: Positive differences between Atlas 14 and Technical Paper 40 imply that infrastructure designed with the latter, is undersized for conditions described in Atlas 14 and vice versa (Source: Lopez-Cantu & Samaras, 2018).
In our research, we found that there were differences in the rainfall volume an engineer would use for their design depending on whether they used TP40 or the latest Atlas 14. Differences were seen in more than 90% of the regions with Atlas 14, and for all storm frequencies. This finding implies that infrastructure that was designed when TP40 was in practice might be under- or oversized for the rainfall conditions described in Atlas 14.
Larger differences were found for events that happen less frequently, such as the 100-year storm. This means that in counties in blue (Fig. 1) infrastructure that was designed under TP40 to hold runoff generated during a 100-year storm is more severely undersized than other smaller structures that deal with more frequent events, magnifying the possible consequences in case of failure. In general, we observe decreases in precipitation in the western U.S., as well as in the Appalachians, and increases in precipitation elsewhere.
Minnesota Comparison
In the case of Minnesota, we found mostly increases in precipitation, varying in magnitude across the state. This means that existing infrastructure, which was largely designed using TP40, will be undersized. Note that Atlas 14 is an analysis of historical information. Research has shown that extreme rainfall has intensified everywhere in the U.S., and these trends extend into the future since climate change will continue affecting rainfall patterns (USGCPR, 2017; Walsh et al., 2014). Infrastructure is certainly not prepared for rainfall conditions projected by the end of the century.
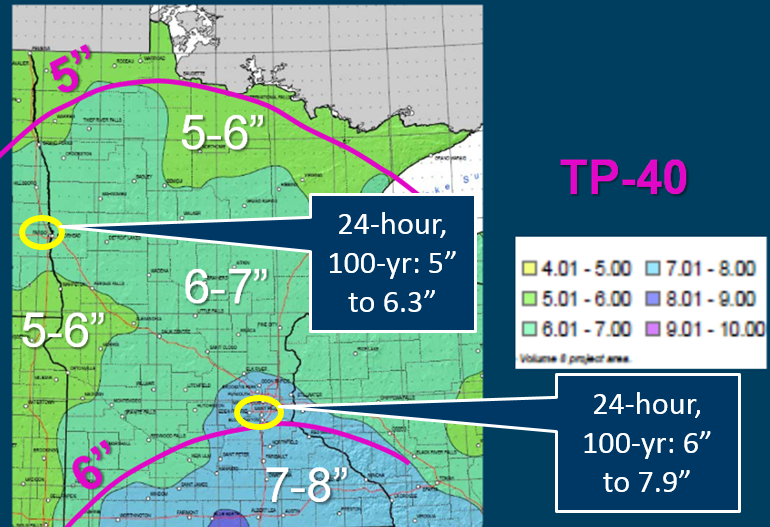 Figure 2: The pink five inch (5") and six inch (6") lines show the 24-hour, 100-year precipitation in Technical Paper 40 (TP40) in comparison to the 24-hour, 100-year precipitation based ont the new Atlas 14. (Source: Compiled by MNDNR)
We believe that the differences we found between atlases can help initiate action. We recommend each state – as part of their resilience planning - design stormwater infrastructure not only based on past rainfall conditions documented in Atlas 14, but also considering changing climate conditions.
Further Reading (all free)
Lopez-Cantu, T., & Samaras, C. (2018). Temporal and spatial evaluation of stormwater engineering standards reveals risks and priorities across the United States. Environmental Research Letters, 13(7), 074006. https://doi.org/10.1088/1748-9326/aac696
USGCPR. (2017). Climate Science Special Report: Fourth National Climate Assessment (No. Volume I; p. 470 pp). Washington, D.C.
Walsh, J., Wuebbles, D., Hayhoe, K., Kossin, J., Kunkel, K., Stephens, G., … Willis, J. (2014). Ch. 2: Our Changing Climate. In J. M. Melillo, T. Richmond, & G. W. Yohe (Eds.), Climate Change Impacts in the United States: The Third National Climate Assessment. U.S. Global Change Research Program.
By Ceil Strauss, DNR, State Floodplain Manager
Reducing flood risk is always important. But with the current wet conditions, and higher probability of flooding in the spring, there is heightened interest in actions we can take to reduce your risk.
Steps everyone can take
-
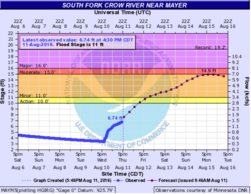
Monitor local water level conditions - Sign up for alerts from your community and the National Weather Service (NWS). Check the NWS river gage locations in Minnesota and select gages in your area to view current river levels, forecasts and outlooks. Note: Sample view of gage with observed and forecasted river levels (to right).
|
|
 |
-
Consider purchasing flood insurance - Anyone in a community that participates in the National Flood Insurance Program (NFIP) can purchase flood insurance. Those with homes & businesses in the low and medium risk areas can purchase the discounted Preferred Risk Policy. Note: there is a 30-day waiting period for the policy to be effective. See more information at www.floodsmart.gov.
-
Build smart - Follow your community's floodplain, shoreland management and other local zoning requirements (including minimum elevations) for new construction, additions or improvements of buildings, and any grading or other development.
-
Action Plans to Reduce Damage (especially for those at greater risk) - Move belongings to higher levels. Save back-up records off-site. Consider needed flood fighting options such as pumps, sandbags, berms, or other protection in advance.
Additional steps for communities:
-
Adopt or update local Emergency Action Plans. The U.S. Army Corps of Engineers has a Community Resources Toolbox with links to preparation guidelines and resources.
-
Enroll in the National Flood Insurance Program (NFIP) - In Minnesota, all counties that do zoning and >500 cities are in the NFIP. In fact, over 96% of Minnesotans live in a community that participates. However, if your community is not enrolled in the NFIP, strongly consider getting enrolled:
* If your community is not participating, contact the MNDNR Floodplain Program staff for assistance with the enrollment process.
* Check FEMA’s Community Status Book for Minnesota to verify whether your community is enrolled in the NFIP. (Participating communities are listed alphabetically.)
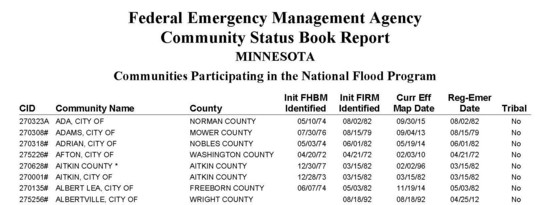 Excerpt from FEMA's Community Status Book for Minnesota
-
Determine flood response priorities - Where will detours and temporary dikes and sandbagging be needed? What critical facilities - i.e., utilities, nursing homes, hospitals, government response centers - are most at risk? When are evacuations triggered?
-
Think about long-term mitigation options - What projects are in your county's (or community's) latest All Hazard Plan? Learn more at the resource links below.
For more information:
On the Minnesota Division of Homeland Security and Emergency Management site, learn more about hazard mitigation planning, the State Hazard Mitigation Plan, success stories, and FEMA grant programs.
On the MNDNR Floodplain Program site, learn more about:

The National Flood Insurance Program (NFIP) was originally set to expire September 30, 2017. There had been more than ten short extensions, and the program was set to expire Dec. 20, 2019. Congress recently passed an extension to Sept. 30, 2020, and that legislation was signed Dec. 20, 2019.
Many significant reforms are still being considered by Congress. Members of the Association of State Floodplain Managers (ASFPM) can participate in the monthly National Policy Briefing webinars to hear the latest updates.
|
By Ceil Strauss, DNR, State Floodplain Manager
Note: This article incorporates information currently available at the FEMA site noted below for additional information.
FEMA is working on "Risk Rating 2.0," a major update to how flood insurance policy rates are determined. The new rate tables were to be issued in April 2020, and take effect in October 2020, but have now been delayed to become effective in October 2021 (or later).
What are Priorities for Risk Rating 2.0?
The National Flood Insurance Program (NFIP) is redesigning its risk rating system by leveraging industry best practices and current technology to deliver rates that are intended to be fairer, easier to understand, and better reflect a property’s unique flood risk.
- Rates based on fewer, simpler factors.
- Fairer rates - The current rating methodology has not changed since the 1970s, and does not reflect advances in technology or the current understanding of flood risk. Over time, this has resulted in a cost disparity; policyholders owning lower-value homes are paying relatively more than policyholders with higher-value homes.
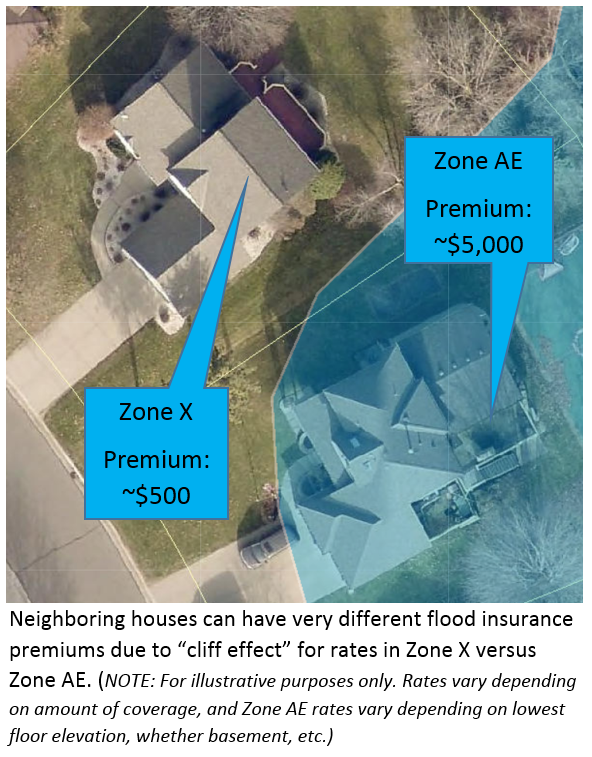
- Focus on structure specific flooding risk - Currently, neighboring houses that are in different zones currently have a "cliff effect," and pay very different rates even through the risk change is more gradual.
|
What Will Change?
Rating Characteristics: The new risk rating plan will help create an individualized picture of a specific property’s risk. FEMA believes this, along with other changes that are a part of Risk Rating 2.0, will provide rates that are easier for insurance agents and policyholders to understand. FEMA also believes these changes will make quoting an NFIP policy less complex for insurance agents. Some of these other changes are expected to include factors like:
• Distance to the coast or another flooding source;
• Different types of flood risk; and
• The cost to rebuild a home.*
Risk Rating 2.0 will comply with existing statutory caps on premium increases. This will help transition policyholders who may face otherwise substantial rate increases.
*By reflecting the cost to rebuild, the new rating plan will also aim to deliver fairer rates for owners of lower-value homes.
For More Information
See the latest FEMA updates on NFIP Transformation and Risk Rating 2.0.

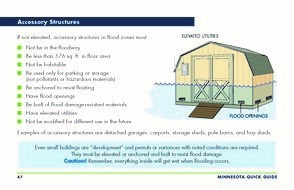
The 2018 Floodplain Management in Minnesota Quick Guide is heavy on useful graphics and targeted at local officials and other professionals involved in floodplain management, as well as landowners.
A 2020 update with additional content on available A Zone supporting data, map appeal options, and more is in progress.
|
How to get a copy:
|
Actual, scheduled, and projected dates since September 2019 Water Talk:
Preliminary Maps
- Rice County (panels) - Nov. 15, 2019
- Goodhue County (panels) - Jan. 2020 (tentative)
- Olmsted County (panels) - Jan. 2020 (tentative)
- Watonwan County - Jan. 2020 (tentative)
- Blue Earth County (panels) - Feb. 2020 (tentative)
- Nicollet County - Feb. 2020 (tentative)
- Pennington County - Mar. 2020 (tentative)
- Le Sueur County - Apr. 2020 (tentative)
- Morrison County - Apr. 2020 (tentative)
- Pope County - June 2020 (tentative)
- Stevens County - June 2020 (tentative)
- Dodge County - ??? 2020 (tentative)
- Wabasha County - ??? 2020 (tentative)
- 2020 (anticipated): Carlton, Chippewa, Itasca, Koochiching, Lake of the Woods, Polk (revised panels), Pipestone (~Dec. 2020), Rock (~Dec. 2020), St. Louis (~ Dec. 2020), Waseca, and Winona Counties
Local Officials Meetings & Open Houses
- Cottonwood County - Dec. 18, 2019
- Goodhue County (panels) - Feb. 2020 (tentative)
- Rice County (panels) - Feb. 2020 (tentative)
- Olmsted County (panels) - Feb. 2020 (tentative)
- Watonwan County - Feb. 2020 (tentative)
Letters of Final Determination (LFDs)
- Scott County - Feb. 16, 2020 (anticipated)
- Wright County - Feb. 16, 2020 (anticipated)
- Marshall County - Apr. 2020 (tentative)
- Yellow Medicine County - June 2020 (tentative)
- Red Lake County - June 2020 (tentative)
Effective (6 months after LFD date)
- Norman County (panels with levees in Hendrum & Halstad) - December 20, 2019
Additional Map Update Information:
|