|
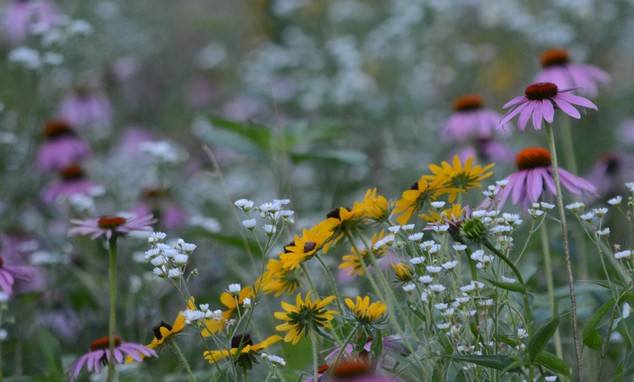
photo credit: MN DNR Beth Knudsen
A Change for the Better
Ready or not, here we go! It's a familiar feeling at the end of summer, to sigh and wish that the days would stop shrinking and the warmth would linger. But ready or not, the change still comes.
We have been preparing you for a change in the WHAF map for over a year. We made a version of the new map available to help ease the transition and now, the switch is official.
Open the WHAF Map App
We hope you enjoy the new tools, easy navigation, and other enhancements found in this redesigned map. The Map Help web page and downloadable guide give helpful details on how to use the new map.
And here are some reminders to get you comfortable with the change...
A few steps to get you started:
Click anywhere in Minnesota to set your location.
|
|
|
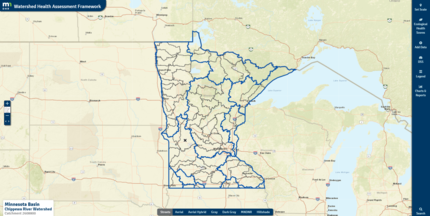 |
Set Scale lets you zoom and mask to different watershed boundaries. Use the 'select all' button to delineate nested watershed boundaries. |
|
 |
|
Switch Basemaps for a quick overview of new options available.
|
|
 |
|
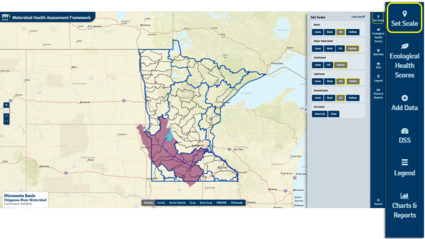
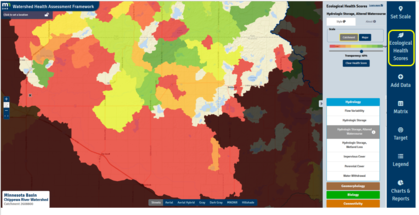
Open Ecological Health Scores to map health scores for each of the 'five components'.
HINT: Click the 'i' to 'identify' the health score value for your location.
|
|
 |
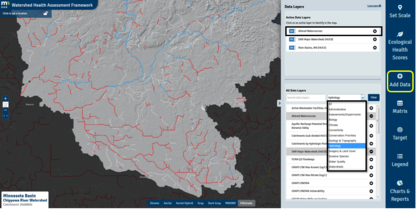
Use Add Data to access an extensive list of layers to add to the map. Use the filters to easily search for layers of interest. |
|
 |
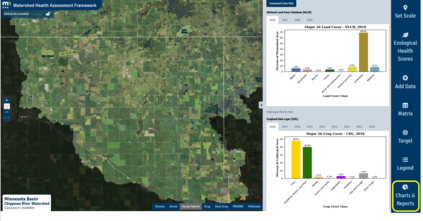
Click Charts and Reports to access Land Cover Charts and link to Watershed Context Reports, Health Report Cards and Climate Summaries. |
|
 |
Some recent improvements include:
- A Watershed Climate Summary can be downloaded for any major watershed in Minnesota from 'Charts and Reports'.
- A suite of the historic Climate Data is available in the map. Open the 'Add Data' tool and filter your search with the word 'climate' to quickly find those new layers.
-
Land Use Charts are updated using the newest National Land Cover Data through 2016 and the Cropland Data Layer through 2018.
There are other enhancements in the works, so keep checking back! The 'Share URL' function will be added soon, as well as other favorite features.
Let us know what you think of the next generation WHAF map. Email us at WHAF.DNR@state.mn.us.
WHAF Map Version 1
And if you really need linger a bit longer, the old WHAF Map is still there. You can open WHAF (Version 1) from the Map Help page or bookmark the link to WHAF map Version 1 to use that familiar map for your ongoing work.
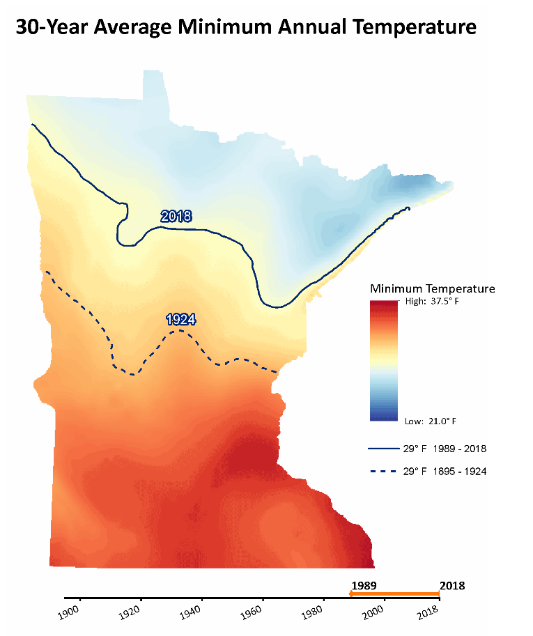
A Change in the Weather
The shift in average minimum temperature; 29F in 1895-1924 (dotted line) and 1989-2018 (solid line)
Click to view this as an animated map of minimum temperatures
Learning from Historic Climate Data
The WHAF team worked together with MN Climatology staff to summarize long term historic precipitation and temperature data in new ways. The result is three new climate related products that reveal patterns of change in Minnesota's climate at the statewide and major watershed scale.
-
Climate Summary for Watersheds - Download statewide and major watershed reports to view summaries of historic climate data for your part of Minnesota.
-
Climate Data Layers in the WHAF Map - Open the WHAF map, Add Data; filter for 'climate'
-
Animated maps of annual and seasonal precipitation and temperature - Click a link in the table to watch the statewide map change over time.
Why is a shift in climate important for managing watershed health?
Natural processes evolve in response to local, regional and global climate conditions. If local climate measurements are showing a shift, other ecological processes will change in response. Communities and individuals making decisions about managing land and water resources for infrastructure, flood protection, habitat protection, water supply, and other needs need to be aware of this shift and consider its potential impacts.
Will the climate keep changing in this way?
Historic data can't answer that question; these are visualizations of the historic data and not a predictive model of future climate trends. You can read more about climate and climate trends on the MN DNR website.
There are many climate related resources available, hopefully this suite of new products adds some local insights as you view and visualize shifts in Minnesota's climate in your neck of the woods. We would love to hear from you; let us know about any interesting observations, conversations or questions. Contact us anytime at: WHAF.DNR@state.mn.us

Viewing Climate Data in the Map
Available climate data layers include:
- Average, maximum and minimum temperature and precipitation (1989-2018)
- Departure of recent conditions (1989-2018) from historic record (1895-2018).
Open the WHAF map; click 'Add Data' to open the data layer panel.
Click the drop down arrow, select 'Climate' to filter the list.
Click on a layer name to add it to the active layers in the map.
|
Key Concept Review: Adaptation
Adaptation is defined as the process whereby an organism becomes better able to live in its habitat or habitats. Climate adaptation in particular is a rapidly expanding field of study and is defined as 'developing and implementing strategies, initiatives, and measures to help human and natural systems prepare for and address climate change impacts.' (Adapting to Climate Change, 4).
As our new WHAF Watershed Climate Summaries and map products show, adaptation efforts will need to consider precipitation and temperature patterns across Minnesota. How do we manage resources well, while baseline climate conditions are shifting? Understanding the growing need for adaptation strategies, while rapidly sharing what works and what doesn't; that will be essential for the future of Minnesota's resource management. Warmer water, less ice, shifting vegetation, new invasive species, extreme rainfall; the list of challenges will continue grow.
Approaches like new designs for road and river intersections are an example of adaptive management that builds on natural processes. Proactively designing our natural and human systems for a range of possible climate conditions will require open discussion and information access. By implementing an adaptation focus, Minnesota can prepare now to adapt well to future conditions.
ADAPTATION RESOURCES:
MN DNR Website:
Climate of Minnesota; Impacts of Climate Change; What DNR is doing
Link to Reports:
Adapting to Climate Change in Minnesota: 2017 Report of the Interagency Climate Adaptation Team
Link to Conference:
Climate Adaptation Conference University of Minnesota, St. Paul Campus, January, 2020.
|