Water Talk Newsletter - June 2019
June 28, 2019
|
Help the DNR celebrate the 50th Anniversary of the Shoreland Management Act by sharing your photos and thoughts about shoreland management. The contest runs from July 1 to August 5 and the winning photos will be posted on the DNR website and at the Minnesota State Fair.
For more information and to upload your photos go to the DNR photo contest page.
|
|
 |
New DNR page with examples of shoreland higher standards
The Innovative Shoreland Standards Showcase page is live!
Local governments all over the state have great approaches to protect the water quality, natural benefits and beauty of our lakes. This new site is devoted to sharing those ideas.
Categories include:
- Bluff standards
- Density / Lot size standards
- Impervious surface standards
- Land Alteration standards
- Limits on land uses and structures
- Nonconformity standards
- Septic dimensional standards
- Shoreland district and waterbody classifications standards
- Structure setback standards
- Vegetation management standards
|
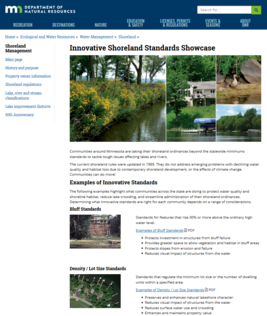
For each category, there is a link to a document with a more in depth discussion of that topic, including: discussion of benefits, types of approaches, specific examples of ordinance language currently in use (mainly by Minnesota cities and counties), and citations of example sources. For example, see the first page of the "Vegetation Management Innovation Standards" below.
Have other good examples to share?
We will regularly add to this page and welcome any innovative approaches you have that are not included. Contact Matt Bauman (651-259-5710) or Dan Petrik (651-259-5697).
Editor's note: An innovative floodplain ordinance standards page is anticipated within the next year. If communities, watersheds or others have innovative ideas to share, please contact Ceil Strauss (651-259-5713) or floodplain.dnr@state.mn.us
The National Association of Insurance Commissioners (NAIC) has a new interactive quiz on flood-related insurance called “WHAT THE FLOOD!” It’s a quick series of questions testing your knowledge. Take the WHAT THE FLOOD! quiz yourself – you may learn a few things!

By Salam Murtada, Floodplain Hydrologist – DNR Floodplain Program
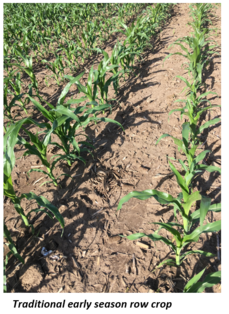
The Watershed Modeling Group in the DNR Division of Ecological and Water Resources has been evaluating best management practices (BMPs), mainly in agricultural areas, to determine their effectiveness in reducing surface water run-off. The group recently evaluated BMPs that included using cover crops. Cover crops include a range of vegetation options typically planted in row crop areas between the harvest and planting seasons to cover the normally barren soils.
Cover crops provide many benefits. They are currently used to improve water quality and soil health. They also reduce surface water runoff and potential soil erosion by increasing the soil’s ability to infiltrate water (hydraulic conductivity). Cover crops also increase organic matter in the soil, which improves the water storage capacity in the root zone.
|
Other benefits of cover crops include: reducing nitrogen and phosphorus reaching our streams; providing nutrients for crops; maintaining soil moisture for crops; supporting habitat; and pest management and weed control.
The use of cover crops can also reduce soil loss, which can be especially important for water quality during the pre-growing season when the ground is otherwise fallow and vulnerable to extreme rainfall events. Soil loss is a “lose-lose” situation for the farmers and our natural resources. Soil loss carries valuable nutrients and applied fertilizers from the field, and can contaminate our streams.
|
But can cover crops also help control flooding?
The answer is yes, particularly during non-growing seasons. In a watershed study involving the 323 square mile Shakopee River Watershed, the group simulated using cover crops on all the row crop areas (mainly corn and soybeans), which comprise approximately 68% of the watershed. The study did not convert any current agricultural areas to other land uses (such as prairie). Some of these areas do use drain tiles, however, the effects of drain tiles on peak flows will be addressed in a future article.
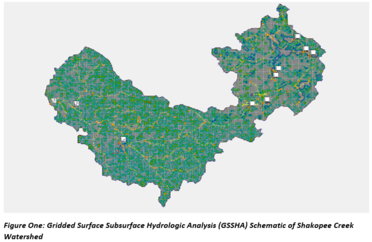
The group used a hydrological model called Gridded Surface Subsurface Hydrologic Analysis (GSSHA) model. GSSHA can distribute the flow across the watershed using grids and route it through the river network. The model simulates complex spatial interactions between the surface and subsurface soil layers, including the water table, based on the soil conditions specified in each grid cell. In “long simulations,” where the model was run to simulate the effects of cover crops over several years of historical rainfall events, the group observed peak flow and run-off volume reductions, especially during the non-growing season. The results also showed the effects of hydraulic conductivity (infiltration) and surface roughness (vegetation) were important during shorter periods of rain, and the effects of factors such as evapotranspiration were more important in reducing runoff over longer periods. Hydraulic conductivity affects the rate of infiltration whereas surface roughness affects the routing of surface water across the gridded landscape.
|
But what happens when we apply the 1% annual chance rainfall event?
After modeling the 1% annual chance (aka 100-year storm) synthetic storm event based on the NOAA Atlas 14 rain intensity, the group compared the results using existing conditions versus simulated cover crops. For the growing season, the peak flow reduction was only around 4%. However, for the non-growing season, the peak flow reduction was much more significant, at 30%, which raised the following questions:
- How could using cover crops cause this dramatic peak flow reduction?
- Why was the reduction more significant for the non-growing fallow-ground conditions, when compared with the growing season?
- What process or factors contributed to the reduction?
Knowing that the rate of the 1% annual chance precipitation would still overwhelm the rate of infiltration despite the increase in hydraulic conductivity due to cover crop, we needed to further investigate which of the two main factors caused the 30% reductions, hydraulic conductivity or surface roughness. The long term effects of evapotranspiration did not apply in this case.
What factors contributed to the significant reductions in peak flow?
To address the third question, the group modeled the changes in hydraulic conductivity and roughness separately for the non-growing season, in order to determine the contribution of each on the cumulative discharge at the watershed outlet. The results showed that the increase in roughness alone caused 18% peak flow reduction, whereas the increase in the hydraulic conductivity alone caused only 2% reduction. However, when applied simultaneously, they lead to a cumulative reduction of 30%.
|
Thus, based on the results of the Shakopee Watershed study, the group found that using cover crops over the row crop areas can increase the surface roughness at the small scale level, creating localized water storage areas. The many localized water storage areas slowed the energy of water flow across the landscape, dramatically reducing peak flow at the watershed outlet. During the growing season the reductions were not significant because both the row crops and cover crops had similar surface roughness, despite the added benefits of increased infiltration. In addition to surface roughness, cover crops also increase soil water retention due to the action of the root system and rainfall interception due to the foliage.
Based on the Shakopee Watershed study, we can say that cover crops can provide flood control benefits in addition to water quality improvements, especially if applied extensively. Rate of infiltration and surface roughness are important for both water quality improvements and flood control; but the rate of infiltration plays the bigger role for water quality, whereas surface roughness plays the bigger role for flood control.
For more information about cover crops:
MnAFPM Conference
The Minnesota Association of Floodplain Managers (MnAFPM) annual conference will be November 13-15, 2019 in city of Marshall. See MnAFPM site or the Call for Abstracts note below for more details.
Note to local officials: Scholarships will be available.
DNR and FEMA Map RISK Workshops
FREE local workshops will be offered over the next year. The training in Glenwood area is expected to be offered in August 2019, and the trainings in the Morris & Windom areas are expected to be offered in September 2019. The exact locations and dates are to be determined, but MnDNR will be updating the Floodplain Training and Education page as we get upcoming trainings confirmed.
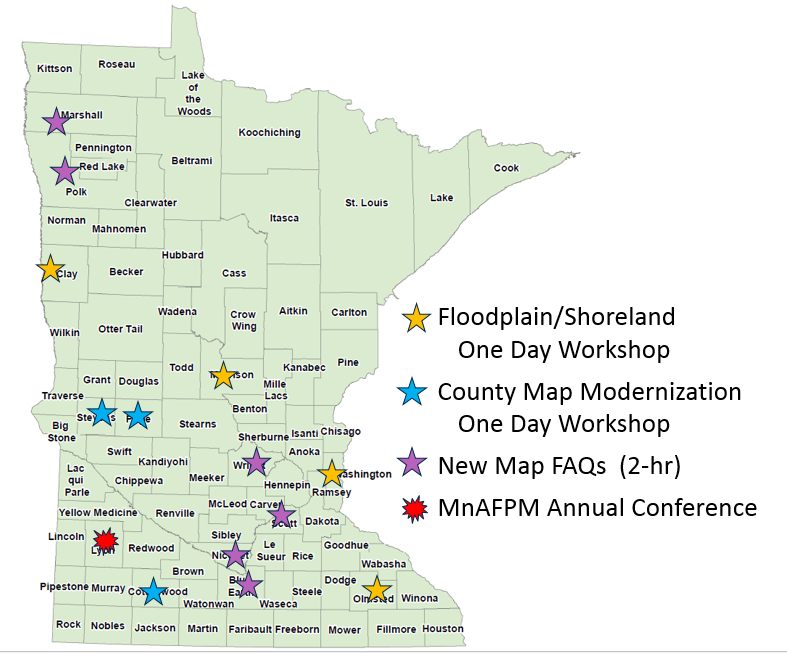
Tentative locations for July 2019 to June 2020 workshops
Types of workshops offered:
-
County Map Modernization Workshop - One day workshop covering topics chosen by county as part of county map modernization process. All are welcome to attend.
Contact Ceil Strauss, 651-259-5713 or floodplain.dnr@state.mn.us for more details on topics to be covered or to RSVP for a training.
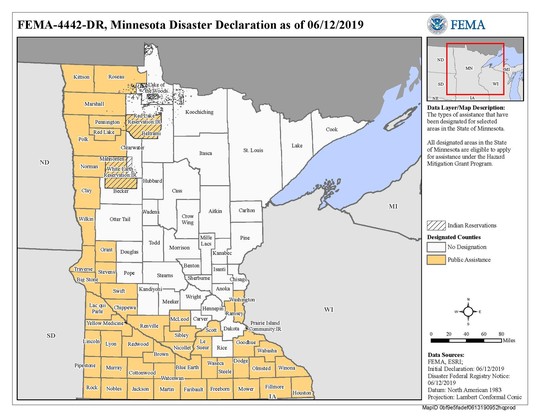
On June 12, 2019 there was a Presidential Disaster Declaration for 51 Minnesota counties and four Indian Communities. FEMA-4442-DR is for public assistance (PA) in response to severe winter storm, straight-line winds, and flooding that occurred March 12 to April 28, 2019. The Hazard Mitigation Grant Program was also authorized, and can be used statewide in any county or community with a current All Hazard plan.
The state's Division of Homeland Security and Emergency Management (HSEM) and county Emergency Managers are the leads in the process to document eligible reimbursable costs for flood protection, debris removal, and repairs to public facilities and infrastructure. Eligible costs will be reimbursed 75% by FEMA. The state legislature has allocated funds to reimburse the non-federal 25% of eligible costs.
See the latest details on response to the Federal Disaster Declaration at the HSEM site.
By Pat Lynch, DNR, Flood Hazard Mitigation Grant Program Manager and Ceil Strauss, DNR, State Floodplain Manager
The first day of summer just passed, and while some Minnesota lakes, rivers and streams are still experiencing water levels higher than normal for this time of year, spring flooding has essentially come to a close.
Despite the widespread and prolonged nature of flooding in Minnesota earlier this year, flood damages were primarily limited to bridges, culverts, roads, and trails.
Little Media Coverage of Flood Damage to Homes and Businesses, Because There Was Minimal Damage!
Relatively little damage occurred to homes, businesses, and public buildings, even though many historically flood-prone communities in the state experienced flooding that ranked in the top ten of all recorded, including: Montevideo, Granite Falls, Rockford, Delano, and Marshall (new Redwood River record).
This lack of damage to structures can be attributed to federal, state and local efforts in Minnesota to prepare for floods, implement sound land use planning, administer strong floodplain zoning ordinances, and mitigate existing flood threats.
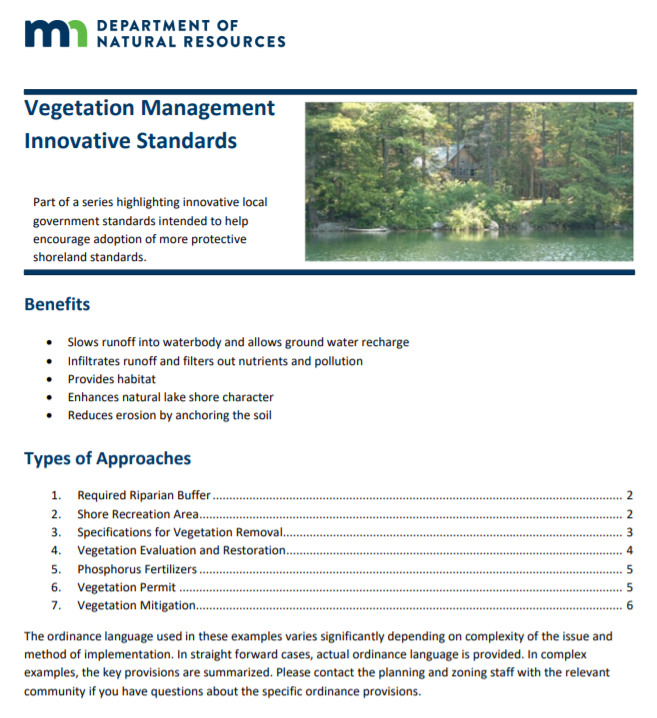
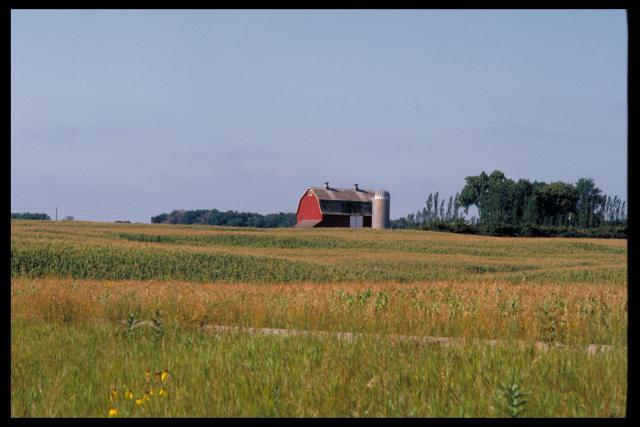
Many local officials told stories of recent flood fights that cost much less and required much less staff time and resources than for floods of similar magnitude in the past. The photo below is from an earlier flood, but illustrates the story we hear repeatedly from local officials in communities that have done flood reduction projects. "The homes that used to flood are a park now. There's flooding there, but no damage to any homes."
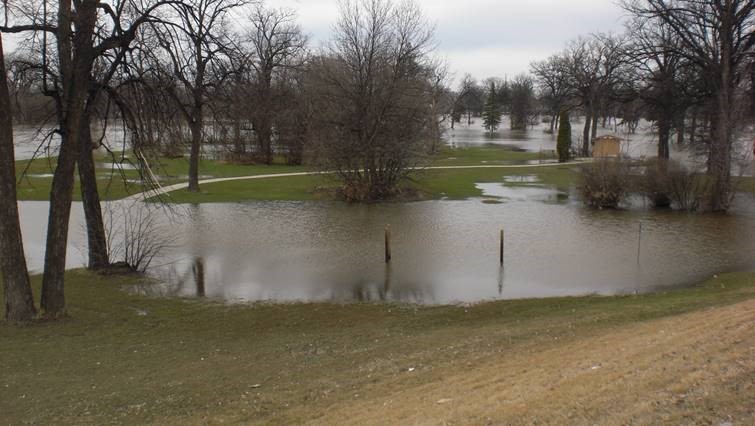
East Grand Forks during flood - example of former residential neighborhood on river side of levee converted to public open space.
By Ceil Strauss, DNR, State Floodplain Manager
Community Copies of Letters of Map Change
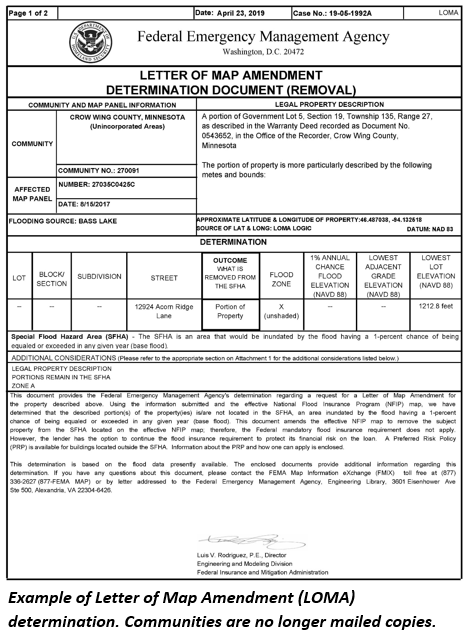
In the past, FEMA mailed communities a copy of any Letters of Map Amendments (LOMAs), Letters of Map Revisions based on Fill (LOMR-F) and other FEMA letter of map change determination documents for those within the community. Starting earlier in 2019, FEMA no longer sends copies to communities.
You can still get copies of the determinations for your community in the following ways:
1. At FEMA Map Service Center site - Select "Search All Products," enter community name and "Search" button, look in "Effective Products" folder for "LOMCs."
2. Email updates - Sign up to get Email updates with links to new LOMAs, LOMR-Fs, etc. - Register for FEMA Flood Map Service Center Email subscription. You’ll need to set up an account, but can set up frequency of the email updates and select the locations (i.e., community, county or state) and FEMA mapping products of interest.
|
3. Search for LOMAs and LOMR-Fs on interactive map - The locations of LOMAs and LOMR-Fs are shown on FEMA's Flood Map Changes Viewer (FMCV) and FEMA's National Flood Hazard Layer (NFHL) viewer sites. See an example of the purple dots showing the locations of LOMAs in the screen shot below. Note the following:
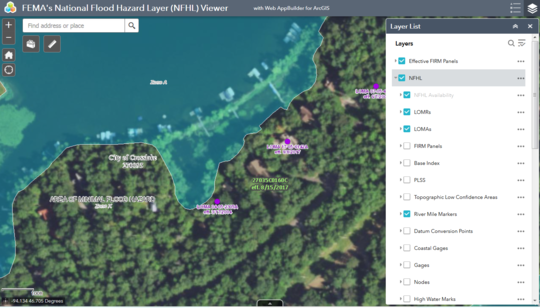
Sample view of LOMA locations in FEMA's National Flood Hazard Layer (NFHL) viewer
New Floodplain Management and Shoreland Management web sites have been prepared in honor of the 50th anniversary of both programs this year.
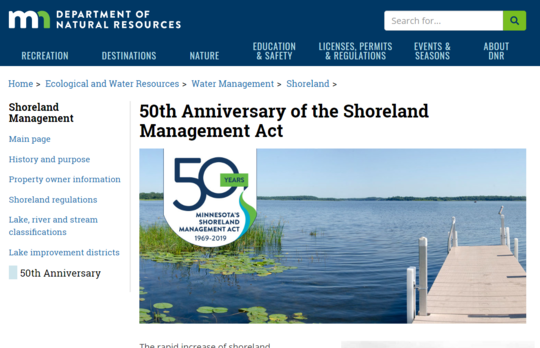
Shoreland Management 50th Anniversary
The new Shoreland Management web site includes information on the history of the program and a comparison of shoreland development in 1969 and now.
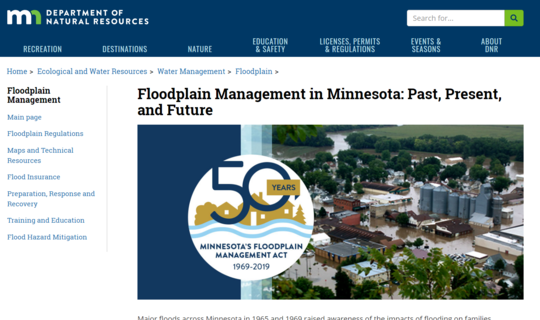
Floodplain Management 50th Anniversary
The new Floodplain Management web site focuses on floodplain management past, present and future. The page includes some history, the importance of local and state partnership, and Minnesota's expanding flood risk. Examples of good flood risk reduction projects and higher ordinance standards around the state are also highlighted.
|