January 25, 2021
Media Contact: Kristina Wieghmink, public information officer
kwieghmink@miottawa.org I mobile/text 616-510-8523
New Ottawa County COVID-19 data hub
to be released Tuesday, January 26
The Ottawa County COVID-19 data dashboard is getting a new look starting Tuesday, January 26, 2021 at 3:30 pm. The improved COVID-19 Hub contains the same data sets as the previous dashboard but has improved loading time and access to even more data sets. Data provide situational awareness of the COVID-19 pandemic locally and statewide and are used to inform policies and decision making.
Why did we create a hub?
Since the first case of COVID-19 was reported in Ottawa County on March 15, 2020, we have continued to track different data metrics to provide situational awareness. Data aids in decision making around our response planning and public health recommendations.
The pandemic continues to rapidly evolve, and it is important to provide the most up-to-date local data in an easily digestible way. The new data hub hosts local COVID-19 related data in one location and links to additional data resources from other agencies.
Does it replace the current dashboard?
All data in the previous dashboard are featured on the hub site, including more statistics and visualizations that were previously available. The new hub site is the main data page, which will still include a link to the previous dashboard version.
How can I access the hub?
Visit the Ottawa County COVID-19 Response page at miOttawa.org/COVID19 and select the COVID-19 Data button. The Data Hub also has a feature to translate it into multiple languages by clicking on the Translate button on the left side of the page.
What else is in the hub?
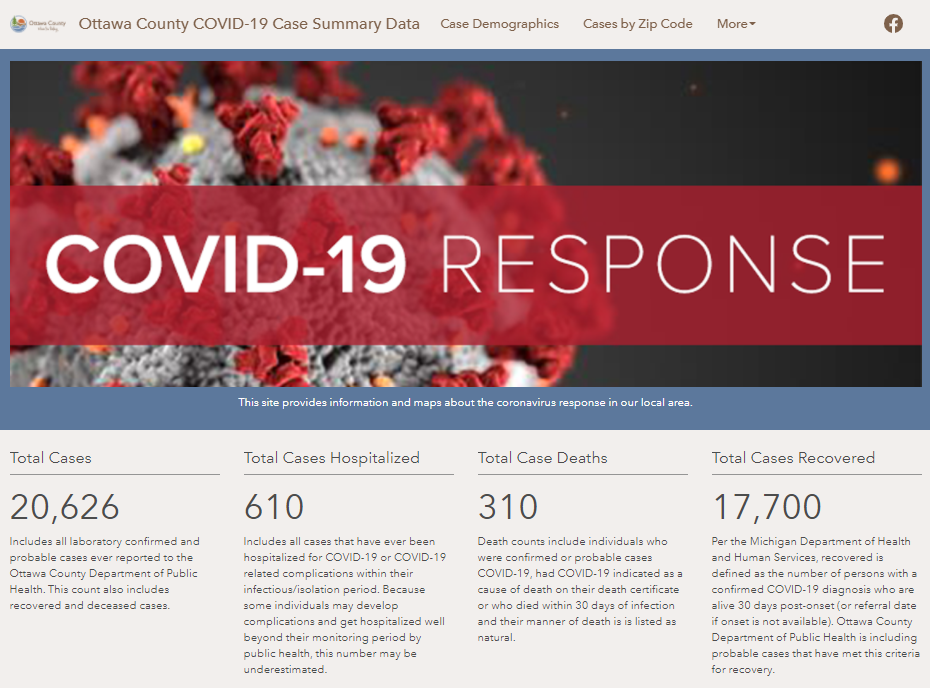
Data Summary:
- The total case counts, hospitalizations and deaths from March 15, 2020, to date. These numbers are further broken down by case status (confirmed and probable cases)
- The average number of cases per day over the last 7 days and the most cases reported in a single day since March 15, 2020
- Epidemic curves showing:
- New cases by day, with the ability to select specific timeframes (last 30 days, last 60 days, last 90 days or since March 2020)
- Total cases by month
- A cumulative curve of cases since March 2020
- The average number of deaths per day over the last 7 days and the highest number of deaths in a single day since March 2020
- Epidemic curves showing:
- New deaths by day, with the ability to select specific timeframes (last 30 days, last 60 days, last 90 days or since March 2020)
- Total number of cases by month
- A cumulative graph of deaths since March 2020
The cards at the bottom of the page will mirror the tabs at the top bar. Either features may be used to navigate through the hub.
Case Demographics:
- Age summary of all cases (average and median ages of all cases)
- A graph of total cases broken down by 10-year age groups (hover over with mouse for more data labels)
- Age summary of all deceased cases (average and median ages of deceased cases)
- A graph of deceased case counts broken down by 10-year age groups (hover over with mouse for more data labels)
- 3 horizontal graphs showing the proportion of the county population within the 10-year age groups, the proportion of cases and the proportion of deaths all within the 10-year age groups.
- Similar stats and graphs are included by sex, race and Hispanic ethnicity
Cases by Zip Code:
- A bar graph with the total number of cases by zip code
- Map of Ottawa County showing cumulative cases in the respective zip codes
Testing Results:
- Includes summary stats of the total number of tests completed on Ottawa County residents, total positive results, total negative results and the overall percent positive
- A line graph of test positivity by week
- A bar graph showing the total number of tests completed by week
Hospital Capacity:
- Summary stats on the total number of cases ever hospitalized and the proportion (percentage) out of the total cases
- 3 graphs showing hospital inpatient bed occupancy, ICU bed occupancy and mechanical ventilator use respectively in Ottawa County, by both the general public and by persons admitted with COVID-19.
External Data Links:
|