January 2019
Jan. 8, 10, 15, & 17 - MRWA - Class I & II Distribution Preparatory Course, Richmond, DEP 10 TCH, BLWSO 20 TCH
Jan. 16 - MRWA - Onboarding New Employees : Maximizing Success, Orono, BLWSO 3 TCH
Jan. 22 & 24 - MRWA - Class I & II Math Review, Richmond, DEP 10 TCH, BLWSO 10 TCH
Jan. 27 Thru 30 - NEWEA - Annual Conference & Exhibit, Boston MA, Variable TCH
Feb. 5 & 6 - MWUA - 93rd Annual February Meeting & Trade Show, Portland, Variable TCH
Feb. 13 & 14 - JETCC - Wastewater 101, Jay, DEP 12 TCH
Feb. 26 - JETCC - Creative Energy Conservation, Fairfield, DEP TCH Pending, BLWSO 6 TCH
Feb. 27 - JETCC - Facility Operation in Cold Climates, York, DEP 6 TCH, BLWSO 6 TCH
April 24 & 25 - JETCC - 2019 North Country Convention, Presque Isle, Variable TCH
The New England Water Environment Association (NEWEA) 2019 Annual Conference & Exhibit, Water’s Worth It, Let’s Go All In will be held January 27-30 at the Boston Marriott Copley Place. Go to www.newea.org for more information.
Mark your calendar for the Maine Water Utilities Association (MWUA) 93rd Annual February Meeting & Trade Show, which will be held at Holiday Inn By The Bay in Portland on February 5-6, 2019. Once again, the conference will feature New Product Technology sessions at trade show booths and classes to appeal to operators, managers and office personnel alike. For more information go to www.mwua.org.
Plan to join the Joint Environment Training Coordinating Committee (JETCC) 2019 North Country Convention (NCC) in Presque Isle on April 24 & 25, 2019. New for 2019; all convention events will take place at Northern Maine Community College (NMCC) and JETCC has partnered with MEWEA and MWUA to bring new and exciting training and exhibits to The County. For more information go to www.jetcc.org.
1. The influent of a primary clarifier has a BOD content of 250 mg/L. If the clarifier effluent BOD is 120 mg/L, what is the BOD removal efficiency?
a. 48%
b. 52%
c. 1.3%
d. 1.2%
2. The total weight of a sludge sample (on a filter pad before drying) is 15 grams. After drying the weight is 0.62 grams. What is the percent solids?
a. 4.1%
b. 4.8%
c. 9.3%
d. 24%
3. A total of 10,000 lbs/day of TSS (dry solids) are removed from a primary clarifier and pumped to a sludge thickener. If the sludge in the clarifier has a solids content of 3%, how many lbs/day of sludge are being pumped to the thickener per day?
a. 3000 lbs/day
b. 30,000 lbs/day
c. 33,333 lbs/day
d. 333,333 lbs/day
4. It is anticipated that 200 lbs/day TSS (dry solids) will be pumped from the primary clarifier of a new plant. If the primary clarifier sludge has a solids concentration of 5%, how many gpd sludge will be pumped from the clarifier? (Assume the sludge weighs 8.34 lbs/gal).
a. 400 gpd
b. 4000 gpd
c. 480 gpd
d. 4800 gpd
5. If 1250 lbs/day solids are sent to the digester, with a volatile solids concentration of 72%, how many lbs/day volatile solids are being sent to the digester?
a. 9000 lbs/day
b. 900 lbs/day
c. 1,736 lbs/day
d. 173,611 lbs/day
After 30 years of service to the Maine DEP in a variety of capacities, most recently as a wastewater compliance inspector in the Augusta office, Beth DeHaas has decided to retire. The staff here in the Division of Water Quality Management would like to wish Beth the very best in her retirement.
For any of you facility operators / managers that had Beth as your DEP assigned wastewater inspector, please route any questions to Beth’s supervisor, Jim Crowley for the time being until Beth’s position can be filled. Thank you.
Contact information:
Email - james.r.crowley@maine.gov
Telephone - 207-287-8898
March 1, 2019 Renewal Deadline Approaching for Odd-Numbered Certificates
Operators with odd-numbered certificates can renew online (www.jetcc.org), by mail (584 Main St., South Portland, ME 04106), or by phone (207-253-8020).
To assist operators, NEIWPCC-JETCC will be sending an email reminder to renewing operators, as well as a mid-term notice to operators whose certificate expires next year (March 1, 2020).
If you have changed your email or contact information, please let NEIWPCC-JETCC know by sending updated information to certification@neiwpcc-jetcc.org.
Timely renewal of your operator certification is very important. Failure to do so makes the certificate inactive, increases cost of renewal, and may lead to other complications.
If your certification is Inactive please contact NEIWPCC-JETCC for further instructions.
If you have questions about the Certification program, please contact Judy Bruenjes at 207-287-7806, judy.k.bruenjes@maine.gov.
Copyrighted material. Reprinted with permission from ©Triple Point Environmental. The appearance of external hyperlinks does not constitute endorsement by the Maine Department of Environmental Protection of the linked web sites, or the information, products or services contained therein.
With the winter season upon us, it’s a good time to examine what happens to a wastewater lagoon when the weather gets cold and water temperatures drop. What can an operator do to optimize winter lagoon operations to get the best possible treatment levels despite the weather?
Impact of Temperature on a Wastewater Lagoons
Water temperature affects virtually every aspect of wastewater lagoon performance. As Steve Harris of H&S Environmental states in his operators’ guide, Wastewater Lagoon Troubleshooting, “Water temperature is a reliable predictor of water quality and can aid the operator in preparing for changes in pond performance.”
Falling temperatures have predictable effects on a winter lagoon operations. Cold weather reduces biological activity, causing BOD, sludge, and ammonia buildup. In addition, freezing water temperature can do the following:
1. Damage structures and equipment: Icing over of liners, baffles, air and power lines, aerators and the like can cause significant damage. Aeration equipment, especially surface aerators, can freeze and malfunction, leaving the lagoon without aeration and more prone to ice over.
2. Destratification of water layers: As temperatures drop in winter, the surface layer of the lagoon cools and becomes denser. The heavier water sinks, displacing the warmer water at the bottom of the lagoon. This causes the lagoon to destratify (mixing of the water layers) and distributes cold water throughout the entire lagoon, which further slows biological activity.
3. Encourage short-circuiting: Warmer influent, if not properly mixed or subject to wind, may short-circuit, or ride warmer thermoclines (layer of warm water) out with the effluent without being fully treated, especially if the lagoon surface is iced over.
4. Buildup of BOD: Every 10 degrees’ reduction in temperature reduces microbial activity by 50%. Bacteria and algae slow down their digestive processes in colder temperatures, allowing BOD to accumulate in the lagoon.
5. Reduce DO: Ice covering the lagoon surface prevents surface adsorption of oxygen from the atmosphere.
6. Sludge buildup: Without sufficient DO, anaerobic conditions prevail and solids settle to the bottom of the lagoon. Since, the bacteria slowdown in colder temperatures there is less sludge digestion and solids may build-up.
7. Nitrification slows way down: Nitrifying bacteria prefer warm water, with an optimal range of 82–97° F. Lagoon ammonia removal virtually stops at 32° F.
8. Reduced phosphorus removal: Like nitrogen, phosphorus removal is temperature sensitive. Lagoons that continually discharge and have effluent phosphorus limits may need to add a tertiary filtration to meet discharge permit limits.
9. Promote conditions for spring lagoon turnover: The ice cover seals in the gaseous byproducts of anaerobic digestion. In spring, warming water prompts a burst of biological activity as dissolved oxygen levels improve and the microbes feast on the backlog of BOD. Gases entrained in the sludge cause it to rise to the surface. As the ice cover melts, the built-up gases and sludge are released all at once—along with terrible sulfurous odors that can linger for over a week—making your neighbors very unhappy.
Optimizing winter lagoon operations
Now that we’ve identified the problems that can be caused by freezing temperature, how can an operator prepare or reduce problems that may develop? The best defense against cold weather lagoon challenges is to be prepared!
Here are some recommendations for optimizing winter lagoon operations:
1. Protect equipment: Be sure surfaces around the lagoon are clear of road gravel, which can penetrate the lagoon liner with the freeze-thaw cycle. Cover or store unnecessary equipment.
2. Check and maintain outdoor equipment: If you have any motors sitting outside all winter long, including blowers or surface aerators, change the oil and check any belts for wear and tear. By properly maintaining these motors now you can reduce the risk that they will fail during the cold winter months when it will be harder to access them.
3. Prevent short-circuiting and spring lagoon turnover: Thorough mixing of the entire water column will ward off thermal stratification (layering of the water marked by a layer above and below of different water temperatures). If the water is mixed and thermoclines are reduced, warmer influent will become part of the overall mix of lagoon water and not flow out untreated. In addition, with an evenly mixed (homogeneous) water temperature and environment, the occurrence of spring lagoon turnover will be minimized.
4. Increase DO to reduce BOD and sludge buildup: As biological activity decreases in the winter months, BOD can build-up in the lagoon. Microbial populations require dissolved oxygen to digest BOD and keep it from building up as sludge. Make sure that you are providing sufficient oxygenation by adding aeration as needed.
To generate valid and defensible data labs must incorporate appropriate QA/QC practices into the routine operations at their facility. This can seem like a daunting task, one that is complicated by the use of terminology that can be easily confused or misunderstood.
Many test methods require the routine analysis of replicate and/or duplicate samples. These terms are sometimes used interchangeably, while they are similar there are some important distinctions that are worth noting.
A replicate is a sample that is divided into subsamples after collection. The subsamples are analyzed and the results are compared to assess laboratory measurement precision. Some methods specify criteria for how close replicate analysis results must be, if the method does not give criteria then the lab has to generate their own criteria using internal QC data.
A duplicate is a sample that is collected at the same location and time as another sample, each in individual containers. Comparing the results of duplicate analyses not only assesses laboratory measurement precision but also includes the additional uncertainty due to sampling procedures.
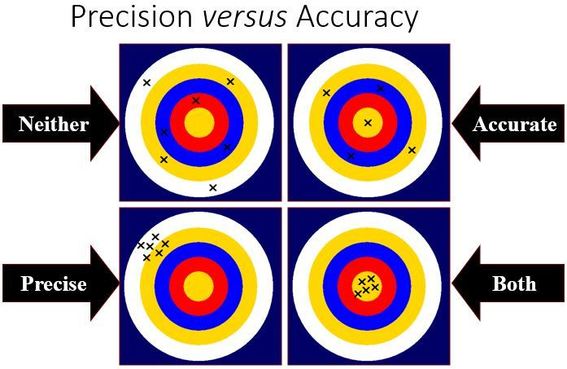
The term precision mentioned above is often mentioned in conjunction with accuracy. Both are important when assessing the validity of laboratory data.
Precision refers to the repeatability of test results in your laboratory. An analogy that is often used is that of a dart board, if your lab results have good precision they will all be close to one another on the dart board, but not necessarily close to the bullseye. See the figure below for a visual representation of accuracy and precision.
Figure 1: Precision versus Accuracy
 As mentioned before, replicate analyses are one way to monitor your laboratory’s precision. There are several ways to calculate analytical precision, one of the simplest is finding the percent difference between the 2 numbers. To calculate the percent difference of 2 replicate values, subtract the lower value from the higher value, divide this number by the average of the 2 replicate values, then multiply this number by 100 to get the percent difference.
Once you have this number, knowing what to do with it is the next step. Some methods give criteria for replicate analysis results, for example SM5210B for 5-day BOD test specifies replicates should be within 30%. If the percentage difference between 2 replicates is greater than 30% SM5210B says to identify the results on the report as not meeting quality control criteria. Basically, the result is determined to be unreliable due to low precision. In this instance it would be a good laboratory practice to evaluate all steps of the test procedure to identify potential causes for the low precision. It could be something as simple as the analyst forgetting to put in a reagent or using the wrong amount of the sample; but it could also be a larger issue that requires a corrective action, such as contaminated dilution water.
An example of this calculation with actual data could be replicate 1 result of 221 mg/L and replicate 2 result of 176 mg/L:
High Result minus low result (Replicate Difference): 221 - 176 = 45
Average of replicates: (221+176) / 2 = 198.5
Replicate Difference divided by Average times 100: (45/198.5) * 100= 23%
Therefore, replicate results of 221 mg/L and 176 mg/L for the BOD test would be acceptable using criteria found in SM5210B, since the percentage difference is less than 30%.
Accuracy shows how close your results are to the bullseye. Accuracy is assessed by analyzing a sample with a known value and comparing the results to established acceptance criteria for the known sample. Analysis of the DMR-QA samples is an example of using a sample with a known concentration to determine the accuracy of a test method. Certified reference material (CRM) can be used on a more frequent basis to monitor laboratory accuracy. CRM, also commonly referred to as QC Standards, are available from most proficiency test providers and come with a certificate of analysis showing the acceptable range for results. These standards can be analyzed weekly or monthly to verify the analytical method is being performed with the appropriate level of accuracy.
While there are other elements necessary to ensure valid data, routine monitoring of your laboratory’s accuracy and precision is an integral part of laboratory operation. Monitoring these results can be particularly useful in helping to spot trends that indicate potential problems before they become major issues. Control charts are a very useful for identifying trends in data for both replicate and QC standard analyses.
Generating valid data is a primary goal of any laboratory. There are many tools available to customize a system that works in your laboratory. If you would like more information on incorporating additional QC measure into your laboratory please contact DEP technical assistance, Brett Goodrich 287-9034 or brett.a.goodrich@maine.gov.
1. b. 52%
% Removed = Parts Removed/Total X 100
% Removed = (Influent-Effluent)/Influent X 100
% Removed = (250-120)/250 X 100 = 130/250 X 100 = 52%
2. a. 4.1%
% Solids = Dry solids/sludge X 100 = 0.62 grams/15 grams X 100 = 4.1% solids
3. d. 333,333 lbs/day
Use the same formulas above but rearrange to solve for sludge, lb/day:
Sludge, lbs/day = Dry solids/% Solids X 100
Sludge, lbs/day = 10,000 lb/day / 3% = 333,333 lbs/day Sludge
4. c. 480 gpd sludge
First find lbs/day Sludge pumped:
Sludge, lbs/day = 200 lb/day of TSS / 5% = 4,000 lbs/day Sludge
4,000 lbs/day sludge / 8.34 lbs/gal = 480 gpd sludge
5. b. 900 lb/day
1250 lbs/day X 0.72 = 900 lbs/day volatile solids
|