March Compass - eNews from Baltimore Planning

Image of Mount Vernon neighborhood with Compass Logo

A monthly eNewsletter from the Baltimore City Department of Planning

March, 2014

A Message from the Director…

This is an exciting time for a new look at the City of Baltimore's reinvigorated housing market. 

The City added over 9,000 new housing units in the first four years of this decade, many of which are located in and around downtown Baltimore.  Young professionals are flocking to downtown and other walkable, urban neighborhoods in growing numbers.

While the housing market throughout the City still varies from neighborhood to neighborhood, there are more and more reasons to be optimistic about the future of the entire city.  The housing market typology is being used to strategically direct our limited resources in an effort to make the biggest possible impact on our neighborhoods.  The INSPIRE project, for example, is developing strategic action plans around every new school being constructed under the Twenty-First Century Schools initiativeThe goal is to leverage this historic investment to grow and improve the surrounding neighborhoods for both new and existing residents.

We look forward to a future where every neighborhood is a great place to live, with quality schools, sound housing stock and attractive public amenities.  The Department of Planning will continue to use tools, such as the Housing Market Typology, to help make all of Baltimore a great place to live, play, and grow.

Thomas J. Stosur, Director


Facebook Logo

The Baltimore Commission on Sustainability Annual Town Hall Event: Let's Clean Up Baltimore Together!

Photo of Sustainability Turtle with Children

Tuesday, April 21, 2014, 6-8pm at Humanim in the American Brewery Building - 1701 N Gay St, Baltimore, MD 21213

Join us for an informative and interactive evening for the whole family. The event will focus on how, together, we can clean up Baltimore. Talk to other community members, city representatives, and organizations  to learn about what's happening to address our City's trash problem. Participate in fun activities, see what resources are available to you, and learn how you can help build a cleaner, better Baltimore. Food and drink will be provided.

Click here for more information and to register for this free event.

The Baltimore Commission on Sustainability Annual Town Hall Event is a part of Baltimore Green Works, 2015 Annual Baltimore Green Week.

Mayor Stephanie Rawlings-Blake Launches Econview: A New Tool to Track Development in Baltimore

Photo of Construction Cranes

On March 17, 2014, Mayor Stephanie Rawlings-Blake launched EconView, a new online tool that shows different development projects that are underway or planned, or have been recently completed in Baltimore City.

“I want to highlight what is happening in Baltimore, and the exciting growth that is coming to our many different communities,” said Mayor Rawlings-Blake. “This tool provides a new way for citizens, business owners, and potential new residents and investors to gain a better picture of what is being planned, built, and developed in their neighborhoods.”

EconView is an interactive tool that will be regularly refined and updated. Each project listed in EconView also features contact information for the appropriate City agency, helping users to obtain answers to their questions and find more information on individual projects.

EconView was developed by the Mayor’s Offices of Economic and Neighborhood Development and the Mayor’s Office of Information Technology. Click here to explore EconView.

Photo of Facades Under Construction in Fells Point

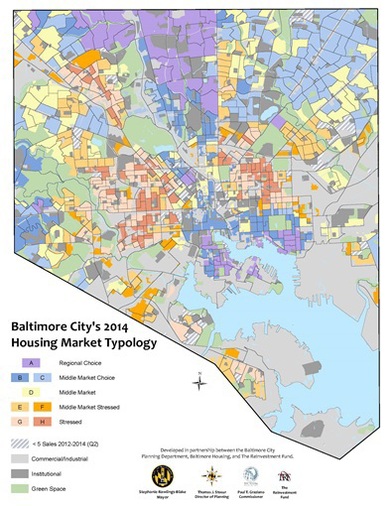
Introducing the 2014 Housing Market Typology

In 2014, Baltimore City’s Planning Department, in partnership with the Department of Housing and Community Development (DHCD) and The Reinvestment Fund (TRF), produced a three-year update of the Baltimore Housing Market Typology (HMT). Previous versions of the HMT were completed in 2005, 2008 and 2011.

Photo of Housing in Cedonia

Since 2005, Baltimore’s Housing Market Typology (HMT) has been used to help guide public policy, market studies, community plans, grant funding applications and capital improvement programming. The 2011 HMT was a critical tool in the City’s Vacants to Value strategy for addressing city-wide vacant housing challenges.

The HMT is a Market Value Analysis (MVA) produced by TRF, which is conducted on a regular basis to provide a report card on the health of the city housing market, and the regular updates help reveal changes or trends. The resulting map illustrates the range of housing markets found throughout the City, which are categorized within eight market types.

Image of residential street with view of downtown

The HMT project, which was funded by the Departments of Housing and Planning, was assisted  by the Housing Typology Task Force, which provided important guidance on data inputs and the ultimate classification of the housing market types. The Task Force consists of members from non-profit organizations, foundations, community developers, academic institutions, private development stakeholders, as well as Planning and Housing staff.

How is the HMT Developed?

The first step in the HMT process was a housing market classification scheme based on quantitative data that grouped areas with similar characteristics into market categories. With input from the Task Force, the 2014 update included the following variables for each Census block group in the City:

  • Median sales price, 2012-2014 Q2
  • Coefficient of variance for sales price, 2012-2014 Q2
  • Foreclosure filings as a percentage of all residential parcels, 2012-2014 Q2
  • Vacant housing units as a percentage of all residential units, 2014
  • Vacant residential parcels as a percentage of all residential parcels, 2014
  • Owner occupied units as a percentage of all occupied residential units, 2014
  • New residential construction permits > $10,000 as a percentage of residential parcels, 2012-2014 Q2
  • Commercial/Residential land area as a percentage of total land area, 2014
  • Subsidized rental units as a percentage of all occupied rental units, 2014
  • Housing units per square mile, 2014

The same variables used in the 2011 HMT were used for the 2014 update, which will allow us to compare the results of the two analyses, and subsequently, compare the changes in different variables that make up the housing market for Baltimore.

Photo of Housing in Old Goucher

This year’s HMT includes the addition of strong rental markets in the analysis.  Areas with very high concentrations of rental properties, like Downtown, were previously excluded because of data restrictions. To overcome this, values were estimated for block groups with over 50 housing units, less than half of which were public housing units. By applying a “capitalization rate” to the market rents in these block groups, a comparable median sales price per housing unit was calculated.

The map below shows the result of the HMT cluster analysis. Market types are categorized from A to H, with A being the highest value market. It should be noted that the variables included in the analysis were not weighted; however, market types are sorted based on the median sales price variable. Block groups with fewer than five sales are not represented due to a lack of data.

2014 Housing Market Typology Map:

Image of 2014 HMT Map
=============

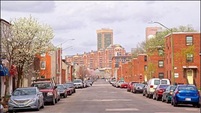
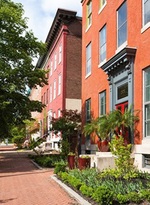
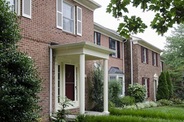
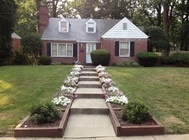
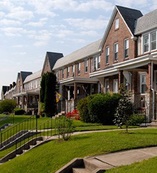
Housing Market Types

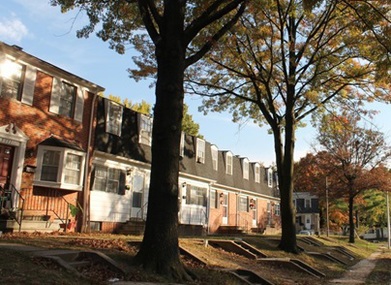
Based on the analysis and identification of the eight market types, the Task Force decided to classify individual market types into five categories that share similar market characteristics, as described below (photos and neighborhood web links from Live Baltimore).

Photo of housing in Bellona Gittings

Regional Choice

Neighborhoods in the Regional Choice market category, such as Bellona Gittings, Cedarcroft, Evergreen, Locust Point, Homeland, Keswick, and Guilford, represent competitive housing markets with high owner-occupancy rates and high property values in comparison to all other market types. Foreclosure, vacancy and abandonment rates are low. Market interventions are not necessary in the Regional Choice market, but basic municipal services such as street maintenance are essential to maintaining these markets.

Photo of housing in Original Northwood

Middle Market Choice

Neighborhoods in the Middle Market Choice category, such as Brewers Hill, Dickeyville, East Arlington, Original Northwood, Hampden, Lauraville, Ridgely’s Delight, Ten Hills, and Upper Fells Point, have housing prices above the city’s average with strong ownership rates, and low vacancies, but with slightly increased foreclosure rates. Modest incentives and strong neighborhood marketing should keep these communities healthy, with the potential for growth.

Photo of housing in Greenmount West

Middle Market

Neighborhoods in the Middle Market category, such as Bayview, Eastwood, Greenmount West, Heritage Crossing, Kenilworth Park, and Woodbourne Heights, have median sales values  above the City’s average, as well as high homeownership rates. These markets experienced higher foreclosure rates when compared to higher value markets, with slight population loss. Interventions are geared toward aggressive code enforcement, in an effort to move vacant buildings as quickly as possible to rehabilitation, which in turn supports existing homeowners. Significant portions of the Middle Market spectrum are covered by Streamlined Code Enforcement.

Photo of Housing in Belair Edison

Middle Market Stressed

Neighborhoods in this category, such as Belair-Edison, Saint Helena, Garwyn Oaks, Lakeland, Union Square, and Winston-Govans, have slightly lower home sale values than the City’s average, and have not shown significant sales price appreciation. Vacancies and foreclosure rates are high, and the rate of population loss has increased in this market type, according to the 2010 Census data. These communities often have under-appreciated assets such as historic housing stock, significant park spaces and choice locations that can serve as building blocks for future revitalization efforts.

Image of Housing in Franklin Square

Stressed Market

These neighborhoods, which include Broadway East, Franklin Square, Gay Street, Penn-North, Rosemont, and Shipley Hill, have experienced significant deterioration of the housing stock. This market category contains the highest vacancy rates and the lowest home ownership rates, compared to the other market types.  It also has experienced some of the most substantial population losses in the City during the past decade. Comprehensive housing market inventions should be targeted in this market category, including site assembly, tax increment financing, and concentrated demolitions to create potential for greater public safety and new green amenities. Support for stable residential blocks is also necessary.

How is the HMT Used?

In general, the HMT assists government officials and community stakeholders to identify and comprehend the various elements of the local real estate markets. By using an HMT, public sector officials are able to better target intervention strategies in weak markets and support sustainable growth in stronger market segments.

In Baltimore, the Housing and Planning Departments use the typology in the following ways:

DHCD - Land Resources Division

  • To guide the overall disposition strategy for Mayor and City Council (MCC) owned properties.
  • To prioritize properties for city-wide marketing efforts.
  • To inform Vacants to Value strategies for addressing vacant housing challenges.

DHCD - Code Enforcement

  • To match strategic interventions with appropriate market conditions.
  • To identify the markets where traditional code enforcement will be most and/or least effective.

DHCD Development Divisions

  • To develop Low Income Housing Tax Credit (LIHTC) and Non Elderly Disabled (NEDs) funding announcements.
  • To guide day-to-day decisions by assessing market capacity and development potential.

Planning Department

  • To inform neighborhood planning and help neighborhood residents understand the housing market forces impacting their communities.
  • To analyze holding capacity, as part of the Baltimore Metropolitan Council’s cooperative forecast process.

Montage of Photos from various neighborhoods