The 2010 Census:
Population Change and Housing Conditions in Baltimore
Every ten years the U.S. Census Bureau conducts a population count of every person in the country, which is then used to designate political boundaries, to give local governments an understanding of the needs in their area, and to direct the allocation of federal and state funds for programs in local jurisdictions. Many neighborhood organizations, foundations and even universities analyze census data to identify areas to target their own limited resources.
To help us dig deeper into the available data, the Department of Planning hired a demographer in 2010. Travis Pate, has been working with data as it becomes available, to assess the City in terms of population change, household characteristics, tenure, and housing vacancy. Pate, along with fellow staff members in the Research and Strategic Planning (RSP) division, has been sharing data analyses, presenting census results, and responding to special requests for data from a number of public and nonprofit organizations.
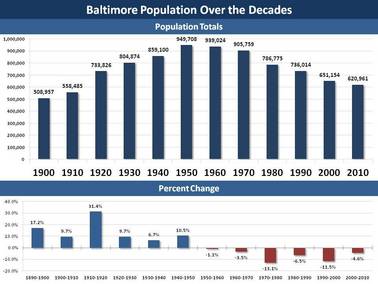
The 2010 Census confirmed some already known facts about Baltimore's neighborhoods, but also caused some concern among local leaders, residents and organizations. Many hoped that Baltimore would show significant improvement since 2000. While some progress has been made, the Census results reported that Baltimore’s overall population continued to decline, by 30,000 individuals since 2000. The Department of Planning is evaluating these numbers, and when you break them down further they show some areas of the City gaining in population, while others declined.
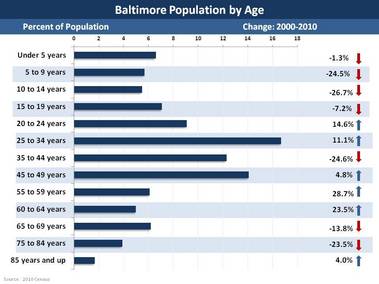
Baltimore’s downtown neighborhoods, for example, showed significant increases in population, mainly among young professionals, between the ages of 18 to 34. From 2000 to 2010, the downtown census tract 401 increased in population by approximately 130 percent. This explosive growth in residential population means Baltimore is making strides in creating a 24-hour, mixed use downtown. While downtown posted significant gains, neighborhoods throughout the city continued to lose families. The greatest losses were among married couples with children, followed by families with female heads of household with children.
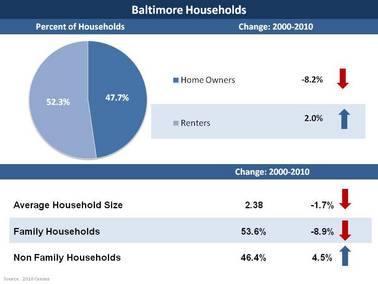
Based on the 2010 Census results, owner occupied units declined overall, while there was a slight increase in renter occupied units. This may be the result of a decline in the percent of families living in the city and increases in young professionals. Vacant units increased by 10 percent, however, this increase was considered minor compared to a 56 percent increase in the previous decade.
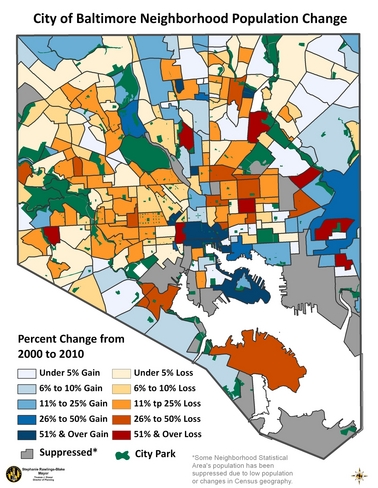
 In spite of slight declines in the population, at the neighborhood level population changes vary, with some faring better than others. From 2000 to 2010, 17 neighborhoods grew by more than 20 percent, while this was true of only 11 neighborhoods between 1990 and 2000.
While the news appears to be mixed, the pace of Baltimore’s population decline is definitely slowing. Based on these trends, and a continued focus on making Baltimore better, safer and stronger, we are optimistic about achieving the Mayor’s goal of growing the City by 10,000 households before the next decennial census.
Further summary file data tables for the City’s neighborhood statistical areas can be found at:
 Stay Tuned for More Census Research in 2012
The Department of Planning’s RSP Division will continue to engage in a thorough analysis of the US Census, and other data sources, to assess ongoing changes in Baltimore neighborhoods – including changes in basic demographics, household characteristics, homeownership rates, vacancies, and more. The results will be shared through a series of “Baltimore by the Numbers” white papers, that will help Baltimore citizens, nonprofits, and civic leaders work smarter and more strategically. Each topical summary will be less than 10 pages long, and will focus on the Division’s analysis of a specific topic, and identify possible policy challenges or considerations the data analysis may raise. Below is a sampling of future Baltimore by the Numbers topics:
The Population - This brief will provide a picture of who lives in Baltimore, who is moving into or out of the City, and where they are migrating to in the surrounding region. It will also focus on population changes in the city, with a focus on age and household composition. In addition, household size and housing tenure will be discussed to explore which household types (i.e. married couples with children) are moving into or out of the city. The demographic and racial characteristics of these households will also be explored.
Population Losses and Vacancies - This topic will focus on historical population losses in the city since the 1950s. In addition, this brief will discuss historical changes in vacant properties over time and identify areas/neighborhoods of the city where vacant housing units have been concentrated.
The Housing Market - This brief will overlay the 2010 Census with the 2011 Housing Market Typology, and provide more descriptive analysis of neighborhood conditions by market types. In addition, this brief will observe neighborhood change using the US Census 2000/2010 and changes between the 2008 and 2005 housing market typologies.
Socio-Economic Trends - This topic will explore socio-economic trends over the past decade, detailing: changes in employment, educational attainment, incomes, poverty levels, occupation types, and more. In addition, this brief will use the analysis in previous Baltimore by the Numbers to determine the relationship between changing households, vacant properties, the housing market and other socio-economic trends.
We welcome ideas or suggestions for additional topics of interest. If you have questions related to the Census or a specific data request, please contact John Pate, Baltimore City’s demographer at john.pate@baltimorecity.gov or 410-396-3796. Future Baltimore by the Numbers census briefs will be posted on the Department of Planning's website.
|