|
This weekly summary produced by the Mayor’s Office of Criminal Justice Coordination is a recommendation of the Jail Population Management Subcommittee supported by the work of the Safety and Justice Challenge.
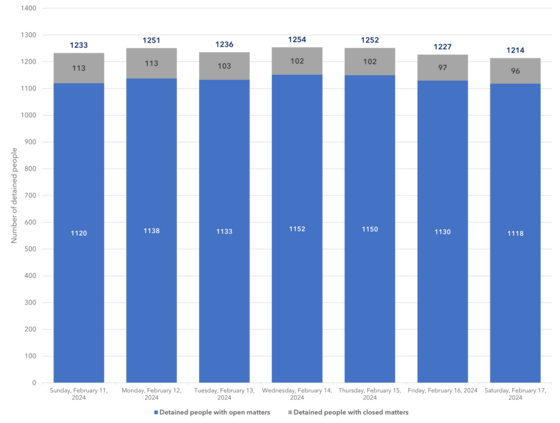 Fig. 1. Daily jail population by legal status, Sunday, 11 February – Saturday, 17 February 2024
For the week ending Saturday, 17 February 2024, the average daily jail population was 1,238 people, a 3% increase from last week’s average daily population of 1,194 people. .
On average, 92% of people detained in the jail last week were in custody for open matters. 54% of the average daily population was detained with a violent offense as their most serious charge at booking.
Not shown in this graphic are the 104 people who, on average, were detained last week on closed matters. Of people detained last week with final dispositions to their cases, on average, 5% had been sentenced to a DOC facility, and 3%, to the Eastern Louisiana Mental Health System.
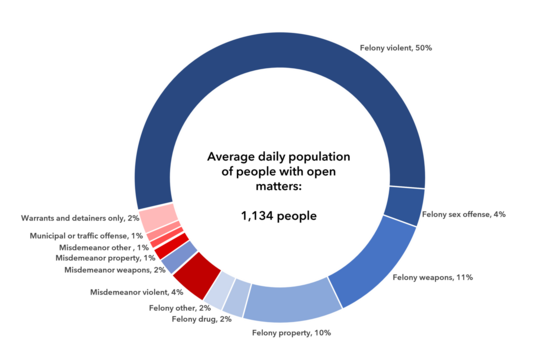 Fig. 2. Average daily jail population of people with open matters by most serious charge at admission, 11 - 17 February 2024
Note that, on average and combined, less than 1% of the average daily population included people with misdemeanor-level sex offenses and drug charges as the most serious charge at booking.
 |
|
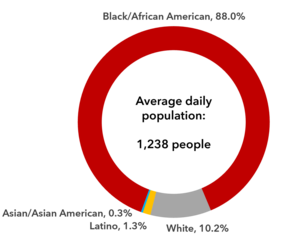
On average, Black people made up 88% of the average jail population last week. In 2021 (the last year for which we have available Census data), Black people comprised 58% of the estimated parish population. Thus, Black people are overrepresented in our average daily population.
|
Fig. 3. Average daily jail population by race/ethnicity, 11 - 17 February 2024
Note that, on average, one person of “other” or “unknown” race was detained last week.
257 people were booked into the jail between Sunday, 11 February and Saturday, 17 February 2024, an increase of over 18% from last week, when 217 people were admitted to the jail.
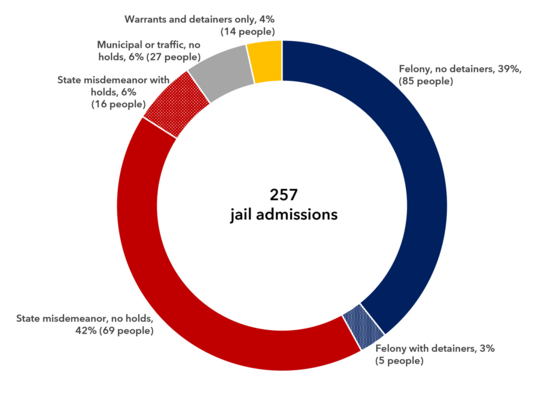 Fig. 4. Jail Admissions by most serious charge at booking, week ending 17 February 2024
108 people (42% of those booked last week) had a felony as the most serious charge at admission. 124 people (48%) were admitted to the jail with a state misdemeanor as the most serious charge.
|
260 people were released from jail custody between 11 February and 17 February 2024, an increase of 38% from last week’s 188 releases.
198 people – nearly 95% of those released last week – left jail custody before the final disposition of their cases, and 14 people were released upon or after their cases’ final disposition. On average, people who were released from jail before the final disposition of their case stayed in custody for 10 days (median = 1 days; minimum = less than one day; maximum = 456 days; standard dev. = 52.1). The 14 people who were released after their cases’ final disposition stayed in custody an average of 140 days (median = 96 days; minimum = 10 days; maximum = 342 days; standard dev. = 116.3).
The weekly jail turnover rate for the week ending 17 February 2024 was 42%, an increase of 8 percentage points from last week. A measure developed by the Bureau of Justice Statistics, the jail turnover rate tells us something about the flow of people into and out of the jail. On average, more than 2 out of 5 people detained in the jail last week had been newly admitted or were very soon to be released.
In 2021 (the most recent year for which we have published data), weekly turnover rate nationwide was 42% (see this BJS report for more details.)
Generally, higher turnover rates indicate larger numbers of jail admissions and releases, relative to the average daily population.
|
The average length of stay was 17 days for the 260 people who were released from jail custody on the week ending 17 February 2024 (min = < 1 day; max = 456 days; standard dev. = 64.0).
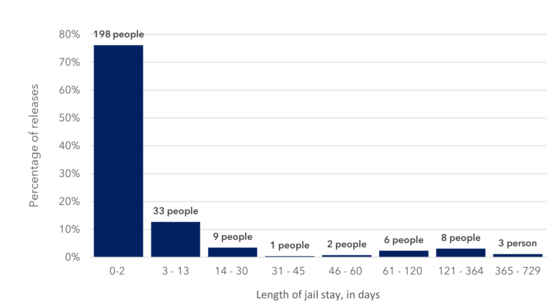
Figure 5. Length of jail stay for people released 11 - 17 February 2024, N = 260
The median length of stay was 1 day for all released people, an decrease of 1 day from last week’s median.
76%, or 198 people, were released after staying in jail for two days or fewer. The 62 people who were released after 2 or more days in jail stayed in jail for an average of 70 days (median = 11 days; standard dev. = 52.1).
We calculate the average daily jail population as the mean of all daily counts during the week.
We calculate length of stay as the difference, in days, between booking date and release date, for people released from the jail during the week.
We determine the most serious charge at booking using a hierarchy of charges, with all felonies being more serious than all misdemeanors.
For more definitions of the terms used in this report, please see our glossary.

As a stakeholder, have you noticed something and wondered if data exists to confirm your observations? At OCJC, we are interested in your observations and data questions. Please reach out to Adrienne Tobler at adrienne.tobler@nola.gov to further discuss the possibility of exploring your questions.
For technical questions, contact Theresa McKinney at theresa.mckinney@nola.gov.
|
|