|
The Air Pollution Control District has released a new dashboard for past odor service requests performed by the APCD. The dashboard can be accessed directly at this link or on the APCD's Air Quality Data webpage, a collection of data on Louisville's air presented in reports, graphs, and maps.
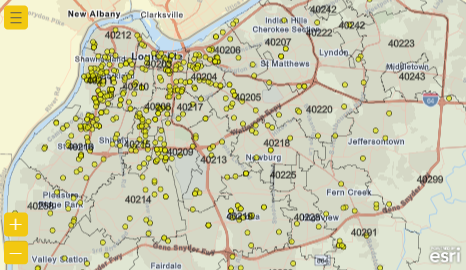
The new dashboard provides a visual representation of the odor service requests performed by the APCD.
Odor service requests are digital records of investigations taken by the District in response to an odor or odor report from a citizen. The dashboard visualizes the service requests through a map and graphs, allowing users to filter by date, zip code, and status.
A short tutorial video on the dashboard has been made available. Additional questions, comments, or ideas on this dashboard or other APCD resources are encouraged, and should be sent to the APCD through our email form.
This is not a dashboard of individual odor reports from citizens. You will see the odor report that prompted each service request but sometimes multiple reports are used in the investigation of the same service request. In this case only the initial report will be used to visualize the service request. Any questions about a specific service request and additional odor reports can be directed to the APCD.
|