|
Updated flood data to help drive regional resilience
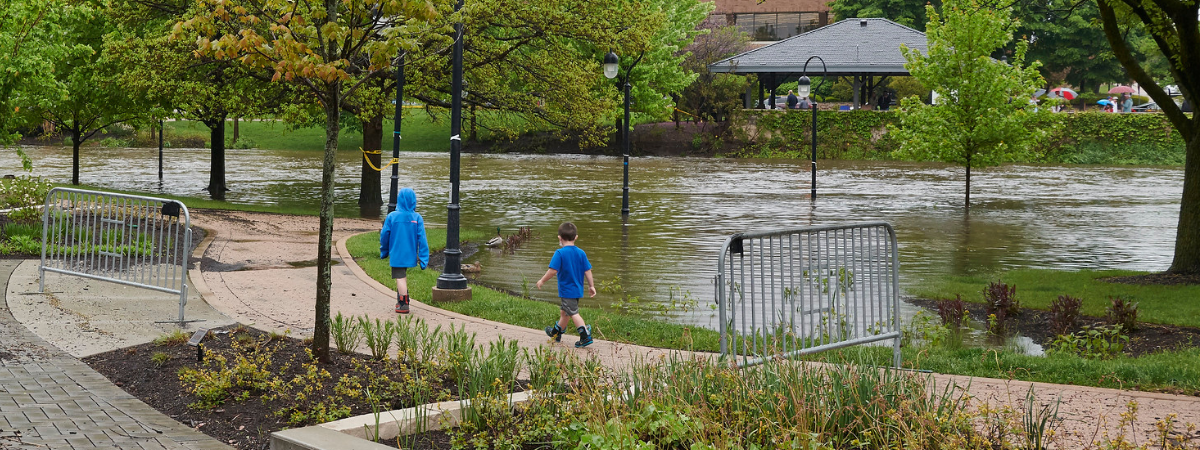
In a continued effort to help tackle current and future flooding challenges, CMAP updated the region’s urban and riverine flood susceptibility indexes (FSIs).
The 2026 FSIs offer a more accurate understanding of flood susceptibility across the region. They are tools to help identify high-level priority areas for stormwater management and flood resilience investments.
What's new?
-
Nearly double the data points: The 2026 indexes include more than 300,000 unique reported flood locations.
-
Expanded geographies: The urban index was expanded to include all developed areas (including those in the floodplain), because they can still experience urban flooding.
-
Better accounting for climate change: The riverine index was expanded to cover developed areas within the Federal Emergency Management Agency and Metropolitan Water Reclamation District's 500-year floodplain and inundation areas (updated from 100-year areas) to account for climate change.
-
County scale: Both the urban and riverine indexes are rescaled for each county.
Explore the data
🗺️ View the regional and county maps
🔎 Explore the interactive map
🔗 Download the data
|
|
CMAP launches next phase of My Daily Travel
Phase two of the My Daily Travel regional travel survey is underway. As travel behaviors change and technologies evolve, transportation planners can use survey results to guide future investments and prioritize improvements for a more efficient transportation system.
Check your mail: Keep an eye on your mailbox now through spring 2027. If you receive an invitation to participate, please visit MyDailyTravelSurvey.com to learn more and complete the survey. Participants who complete the survey will receive a gift card for their time.
Phase one results: Curious about what we learned during the first phase of the survey? Read our analysis of phase one results to see how travel habits across the region are already shaping our planning efforts.
|
|
How do we power the next century of growth? Not with more but with better infrastructure
Illinois' electricity use could more than double by 2050 as buildings, transportation, and industry electrify and electricity-intensive industries continue to grow.
The shift is already underway: More than one-third of Illinois freight carriers expect to operate electric trucks within the next decade. In this future, a single high-volume truck charging hub could require as much electricity as the City of Woodstock — with about 25,000 people — illustrating how concentrated new demand will reshape the local grid.
Our region's ability to provide affordable, reliable, and clean energy in an increasingly electrified future will be critical to remaining globally competitive and meeting our climate goals.
It isn't just about generating more electricity, but making the most of the infrastructure we already have and developing a smarter, more resilient grid.
The Century Plan is exploring how regional coordination can position northeastern Illinois for success.
💻 Read more in CMAP Executive Director Erin Aleman's latest op-ed for Crain's Chicago Business
|
|
How CMAP's Community Data Snapshots support local planning and public engagement
The Community Data Snapshots can help local governments understand their communities' key characteristics, including population, housing, jobs, land use, and more.
They provide high-level information that can be used to prepare for public meetings, open houses, and other engagement opportunities.
💬 Learn how CMAP used the snapshots to engage with residents of River Grove, and how you can do the same for your community
|
|
FLIP students use data and GIS to be planners for a day
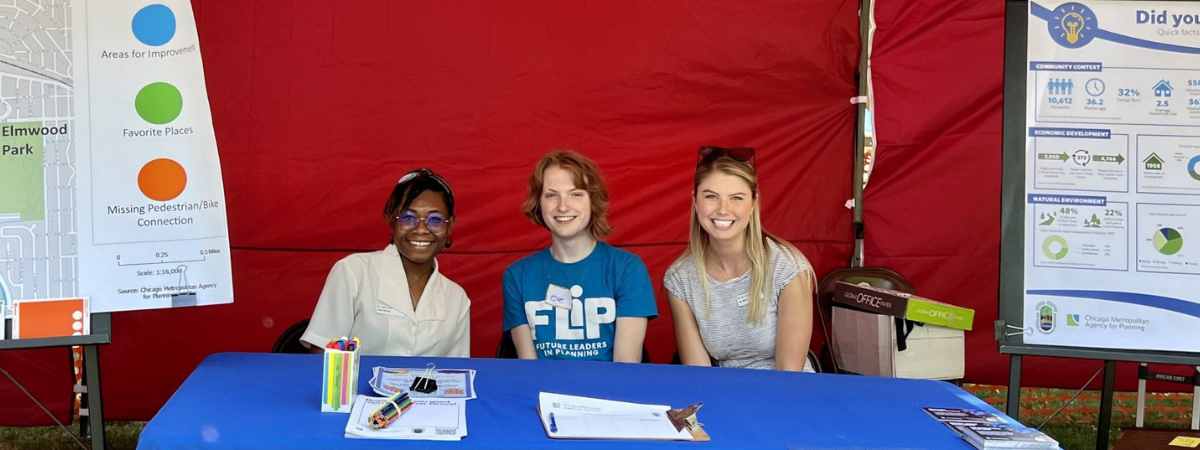
The 17th annual Future Leaders in Planning (FLIP) featured a day where students explored how planning shapes daily life — and how planners use data and geographic information systems (GIS) in their work.
Getting to know GIS
Students learned how GIS can help planners map, organize, and analyze information about various places throughout the region. They explored how GIS can be used to improve transportation, support housing, and make communities more accessible, as well as how CMAP uses GIS to understand the impact of policies and map the region's transportation system.
Putting data to work
Working in groups, students developed creative site plans for the parking lot surrounding Rate Field on the South Side of Chicago. They used neighborhood data to consider what types of development could work at the site, how people would get there, and how their ideas would affect the surrounding community.
Groups sketched their proposals, prepared short presentations, and were challenged to think through potential obstacles to their plans. The activity gave students a chance to experience how data and GIS can move from a map on a screen to a tool for making real-world planning decisions.
🙏 CMAP thanks the students, staff, speakers, and partners who helped make this year's FLIP a success!
💡 See what else the students learned about
|
|
Work at CMAP: Apply for GIS architect position
CMAP is hiring! We're seeking a GIS architect to join our growing Technology, Data, & Applications team. The GIS architect will lead CMAP’s very first enterprise geospatial strategy.
We're looking for a spatial technology leader with:
- At least six years of professional experience
- A bachelor’s degree in geography, urban planning, computer science, information systems or related field; master's degree preferred
- GISP certification preferred
👉 Learn more and apply for the GIS architect position
|
|
|
|