|
Explore CMAP's updated Land Use Inventory
The Chicago Metropolitan Agency for Planning (CMAP) 2020 Land Use Inventory, which identifies up to 50 different land categories in the region, is available now for download.
The Land Use Inventory is a resource for planners, transportation agencies, federal and state agencies, university researchers, non-governmental organizations, consulting firms, and more. It can help you understand existing land uses when creating a comprehensive plan and track progress towards goals. For example, you can analyze the success of development policies, such as tracking if recent policies have led to more infill and transit-oriented development.
|
|
Discover historical aerial photos of the region
The Imagery Explorer showcases CMAP's large collection of historical aerial photographs of northeastern Illinois from 1970 through 1995. The archive includes 6,300 images in 6 of the region's counties.
Historic aerial photographs are valuable resources for planning activities like landscape and land use analysis, environmental impact assessments, development projects, and education. These images provide a method for examining changes in properties, neighborhoods, and land use in general. You also can examine changes in historical, environmental, or architectural information about certain sites over time.
|
|
Public transit dashboards |
|
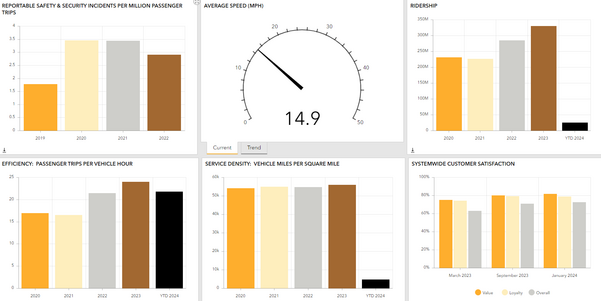
New strategic performance measures dashboards track progress on regional transit metrics
The Regional Transportation Authority (RTA) created three dashboards to track progress on the metrics identified in its regional transit strategic plan, Transit is the Answer. These measures capture user experience, investing in and maintaining transit infrastructure, and how well the RTA and the service boards are maximizing shared resources. Each dashboard defaults to showing the system, but you also can view an individual service operator by using the selector at the top right on a computer or the filter button at the bottom of the page on mobile.
|
|
CTA releases next-generation performance dashboard
As part of its continuing commitment to transparency and to keeping customers informed on all aspects of operations, the Chicago Transit Authority (CTA) unveiled an improved, expanded, and interactive tool to track the agency's performance.
The CTA's updated Performance Metrics Report measures multiple areas, from ridership numbers to operator headcount, elevator and escalator up-time, and bus and rail fleet availability. The dashboard provides a 13-month range to look at historical performance and customize information to user preferences.
|
|
Transportation Statistics Annual Report available
The U.S. Department of Transportation released the 2023 Transportation Statistics Annual Report. This report is an overview of the national transportation system and key indicators, including data and statistics on passenger travel, freight movement, transportation and the economy, system reliability, safety, energy use, and environmental impacts. The report also focuses on closing data gaps and improving the ways transportation statistics are collected, compiled, analyzed, and published.
|
|
NRDC dashboard tracks repetitive flooding in the U.S.
The Natural Resources Defense Council's (NRDC) flood data visualization tool lets you view trends in repeatedly flooded properties across the country, as well as drill down to Illinois and local communities. The tool, which uses data from the Federal Emergency Management Agency, shows the number of severe repetitive loss properties (SRLPs) in each state and county, along with National Flood Insurance Program claims.
As of December 2022, 798 properties in Illinois have met the criteria to be labeled SRLPs. Illinois SRLPs have an average of 5.8 National Flood Insurance Program claims, accounting for 4 percent of the state's National Flood Insurance Program policies but 23 percent of claim payments.
|
|
Assessor's office to host event on modeling commercial value
The Cook County Assessor's Office is hosting an event on Wednesday, April 24, for market practitioners and participants to gain a deeper understanding of how the office assessed and modeled commercial, retail, multi-family, and other properties. It will provide an economic outlook for Chicago, including market highlights and forecasts from Cook County Assessor Fritz Kaegi and his Data and Valuations teams. The event will offer the chance to test drive an interactive data tool to simulate assessment drivers. Panels will include leaders in commercial and affordable housing development and finance.
|
|
CNT answers: What else can I do with the H+T Index?
The Center for Neighborhood Technology's (CNT) H+T Index looks at the cost of housing and transportation in an area to understand affordability. In a recent blog, CNT dives into other metrics in the index, including composite neighborhood scores and environmental characteristics, and how you can use them to understand your community better.
|
|
|
|
|