What's New?
Dataset Backup Retention
The Iowa Data Hub automatically creates a backup copy of a dataset immediately before updating it. This allows a dataset to be restored a previous version if something goes wrong. Backups only begin after a dataset's first update, and datasets marked as "Closed" do not generate backups. Dataset publishers now have the ability to define backup retention rules.
How Retention Works
Backups are removed based on two user-defined rules (managed on the Update Data page):
-
Count Limit (Default: 3, Range: 1–12): When a new update pushes the total number of backups past the limit, the oldest copy is deleted.
-
Age Limit (Default: 90 days, Range: 7–3,650 days): Backups are deleted once they reach their maximum age limit.
-
Safety Net: The most recent backup is never deleted, ensuring there is at least one restore point available.
Minimum Lifespans & Adjustment Tips
-
Update Frequency Alignment: A backup's lifespan must be longer than the time between updates (e.g., daily updates require at least a 2-day lifespan; annual updates require 367 days) so an old backup doesn't expire before a new one is made.
-
When to increase retention: Raise the count or lifespan for critical data, datasets where errors might go unnoticed for a long time, or datasets updated infrequently.
-
When to decrease retention: Reduce limits on extremely large datasets to conserve storage space. Restoring: Reverting a dataset to a previous version requires an assisted restoration process.
More information on configuring backup retention is available in the Internal User Handbook.
Changing Default Settings
Jobs that will remove table backups not meeting retention requirements will begin on Friday, August 28, 2026. If a dataset requires increased retention beyond the default settings, authorizers or publishers should update their dataset settings by close of business on Thursday.
Tips & Tricks
Dashboards: Filtering and Downloading Data
Many dashboards have been built to support filtering the data presented, and downloading those filtered results. This new video series show users how to filter data in a dashboard published on the Iowa Data Hub, and how to download an entire dashboard or download data associated with a specific tile on a dashboard.
Interacting with Dashboards
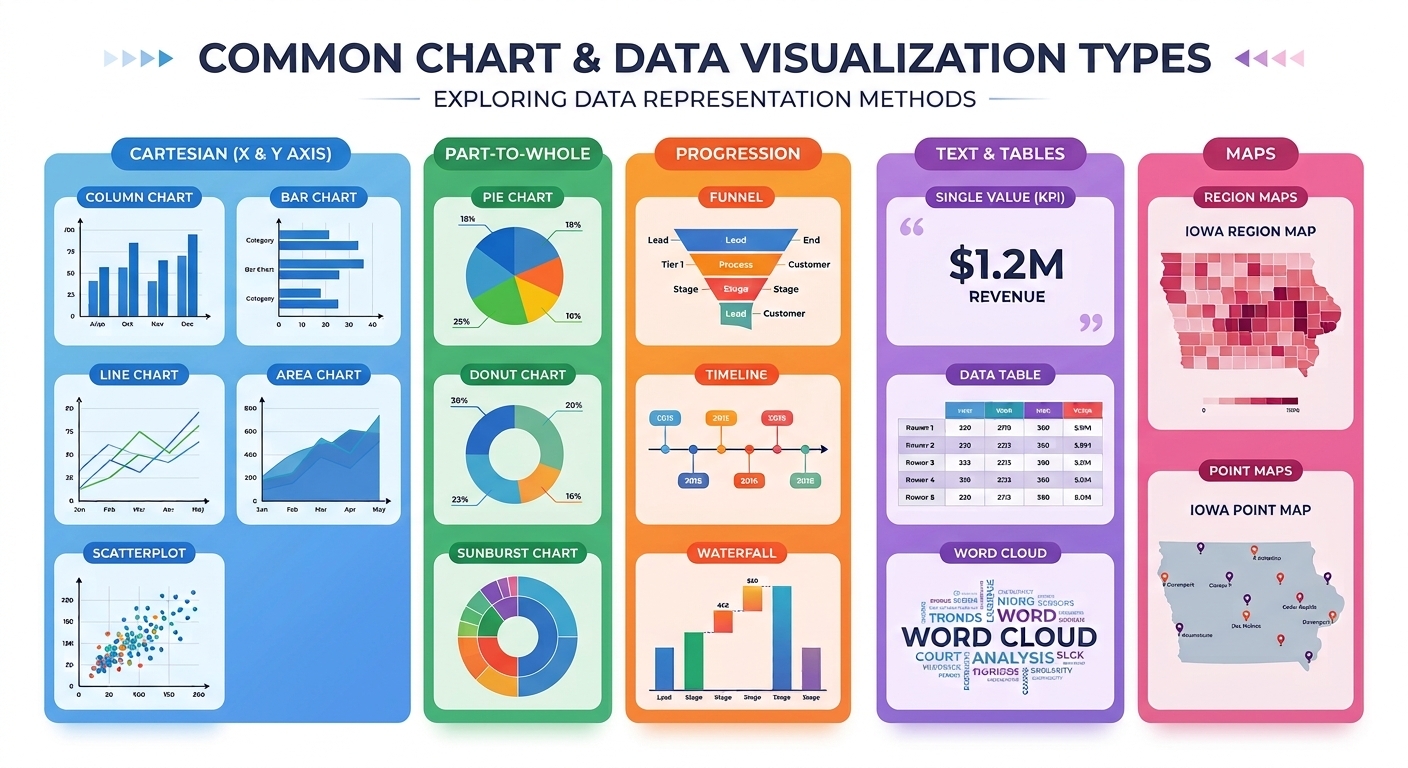
How to Choose the Right Visualization
Using the right visualization is key to effective communication. This section offers a quick guide for picking the right one.
Understand Your Data
Before visualizing data it is important for users to understand what data is available, what it means and how it can be used. Generally data is one of the following types:
-
Categorical Data: Groups or categories with no inherent order (e.g., product types, regions)
-
Ordinal Data: Sequential categories with a specific rank or order (e.g., 1 to 5 star ratings)
-
Continuous/Quantitative Data: Numerical data that change over time or across variables.
Every dataset published on the Iowa Data Hub provides metadata that describes the data making up the dataset, including data types, column names and descriptions, schemas, and how the data relate to one another.
Know Your Audience
Tailor complexity based on who views the data—does the audience require a high-level summary or detailed comparisons? What questions do that have?
Pick the Right Chart
| Category |
Chart Options |
Best Used For |
| Cartesian (X&Y Axis) |
Column, Bar, Line, Area, Scatterplot |
Comparing values across categories or tracking changes across continuous dimensions. |
| Part-to-Whole |
Pie, Donut, Sunburst |
Showing proportions of a whole totaling 100%. |
| Progression |
Funnel, Timeline, Waterfall |
Tracking step-by-step processes, event schedules, or cumulative gains/losses. |
| Text & Tables |
Single Value (KPI), Data Tables, Word Clouds |
Highlighting a single headline number or displaying detailed raw tabular data. |
| Maps |
Region, Point |
Comparing values tied to geographic locations. |
Other Suggestions
- Use high-contrast colors meeting accessibility standards to ensure data is easily distinguishable.
- Include descriptive titles, clear axis labels, and alternative text.
|