|
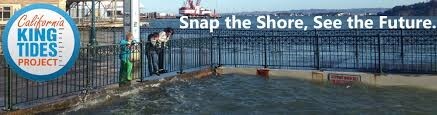
Join us Mondays as the Clean Water Team shares information and resources on watersheds and water quality monitoring. This Monday is about King Tides and how you can participate in California King Tides Project's Snap the Shore, See the Future.
Did you miss this year’s King Tides? If you did, don't worry, you have one more opportunity this year to observe King Tides and participate in a unique crowd-sourcing science project. The next King Tide dates are. are November 15-17 and December 13-15, 2024.
What are King Tides?
While the term "King Tide" isn't a scientific term, it is used to describe very high tides, caused when there is alignment of the gravitational pull between sun, moon, and Earth. Higher than normal tides typically occur during a new or full moon and when the Moon is at its perigee (the point in the moon’s orbit when it is nearest to the earth) or during specific seasons around the country.
During full or new moons — which occur when the Earth, sun, and moon are nearly in alignment — average tidal ranges are slightly larger. This occurs twice each lunar month (about 29.5 days on average). The moon appears new (dark) when it is between the Earth and the sun. The moon appears full when the Earth is between the moon and the sun. In both cases, the gravitational pull of the sun is ‘added’ to the gravitational pull of the moon on Earth, causing the oceans to bulge a bit more than usual. This means that high tides are higher and low tides are lower than average. These are called 'spring tides.' A spring tide—popularly known as a "King Tide"—refers to the 'springing forth' of the tide during new and full moon.
|
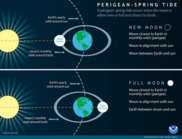
Typically between 6-8 times each year, the new or full moon coincides closely in time with the perigee of the moon — the point when the moon is closest to the Earth. These occurrences are often called 'perigean spring tides.' The difference between perigean spring tides and spring tides that occur closer to the moon’s apogee are location dependent and significantly influenced by tidal range, but can be quite large. It is not uncommon for high tides during a perigean spring tide to be more than a foot higher than high tides during ‘apogean spring tides’. In places like Anchorage, Alaska, which has a tidal range over 30 feet, the difference between spring tides can be 3 feet or more at high tide!
|
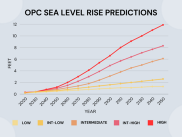
In the past century, global mean sea level has increased by 7 to 8 inches with human influence the dominant cause of observed atmospheric and oceanic warming. Given current trends in greenhouse gas emissions and increasing global temperatures, sea level rise is expected to accelerate in the coming decades, according to the most recent available science, by the year 2100, sea levels may rise by 1 to 6.6 feet (0.3 to 2.0 meters) (OPC 2024). While over the next few decades, the most damaging events are likely to be dominated by large El Niño - driven storm events in combination with high tides and large waves, impacts will generally become more frequent and more severe in the latter half of this century.
- Sea levels have increased over the past century by about 200 millimeters (mm) or 8 inches (″) in San Francisco and La Jolla.
- Sea levels have risen at other locations along the California coast except for Crescent City in northern California, where it has dropped by about 0.8 mm or 0.03″ each year. At this location, the coastline is rising faster than the sea level due to the movement of the Earth’s plates. However, projected sea level rise is expected to outpace vertical land motion in Crescent City, leading to higher sea levels.
The impacts of sea level rise in California will affect almost every facet of our natural and built environments and pose major threats to millions of residents, infrastructure, housing, natural resources, and economies in low-lying coastal areas. Natural flooding, erosion, and storm event patterns are likely to be exacerbated by sea level rise, leading to significant social, environmental, and economic impacts.
Climate-driven sea level rise and storms are predicted to magnify coastal hazards such as flooding, beach erosion, and cliff retreat. Sea level rise can also cause saltwater to infiltrate groundwater, making it unsafe for drinking. This intrusion also raises groundwater levels, increasing the risk of floods, damaging buried infrastructure (such as gas lines, underground storage tanks, and septic systems), and potentially releasing harmful contaminants and also leading to a loss of ecosystem health.
Sea level rise hits communities already struggling to adapt to climate change the hardest, including low-income communities and communities of color, where hazardous industrial sites are often found. Coastal Tribes like the Amah Mutsun and Chumash Tribes also face unique impacts on their culture and ways of life. For example, traditional places where the Tribes used to collect shells, seaweed, and other materials are increasingly out of reach.
|
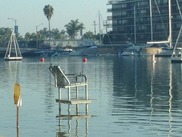
When King Tides occur during floods or storms, water levels can rise higher and have the potential to cause great damage to the coastline and coastal property. The California King Tides Project helps us visualize future sea level by observing the highest tides of today. You can help by taking and sharing photos of the shoreline during King Tides to create a record of changes to our coast and estuaries. www.coastal.ca.gov/kingtides/index.html
|
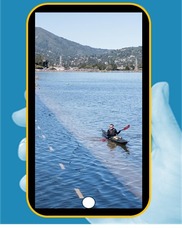
Use your smart phone or digital camera to participate in the Project by taking and uploading photos of king tides through the King Tides Photo Upload form. Start by choosing where you'll go to take your photos and then look at the tide map/chart to find out what time and how high your king tides will be. Take your photos as near to high tide time as you can. Your photos will be displayed on an interactive map. (If you'd like to share a video clip of king tides with us, please email kingtides@coastal.ca.gov for instructions.)
Some of the most powerful images are taken in areas that are subject to flooding and erosion, and of places where high water levels can be gauged against familiar landmarks (such as cliffs, rocks, roads, buildings, bridge supports, sea walls, staircases, and piers).
In addition to uploading your photos, you can also share them on social media using #kingtides. We'll be liking and sharing your posts throughout the King Tides season
|
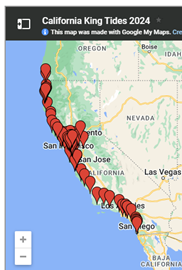
Find your King Tide location on the map. If you have trouble viewing the map on this webpage, open it in a separate window. You can also check NOAA's Tides & Currents webpage directly to find additional tide information.
Depending on location, there may be relatively high tides a day before our statewide King Tides dates, or one of the King Tides dates may be significantly higher than others. If you're flexible, try to photograph the tide on the day of your location's highest tide. Storm swells may increase water height on King Tides and non-King Tides days, so it's helpful to check swell forecasts. Focusing on our designated King Tides dates allows us to create a "snapshot" of the whole coast on the highest predicted water levels of the year.
Tide tables are graphical representations of tidal data, providing information about the timing and height of tides at a particular location.
|
* LEARN HOW TO UPLOAD YOUR KING TIDES PHOTOS *
To use the app: You can download a PDF of the instructions below, including screenshots of the app.
How are King Tides photos used?
King Tides photos help:
- document current flood risk in coastal areas,
- visualize the impacts of future sea level rise in a community,
- ground-truth and validate climate change models by comparing model predictions with the high-tide reality,
- serve as a living record of change for future generations.
Photos may be used in presentations, exhibitions, websites and publications on sea level rise impacts, coastal initiatives, and climate action. Photos may also be used by government agencies for research and planning to assess where the coastline is most vulnerable, and by scientists to better predict future sea level rise. Teachers and students use these photos to learn about our coastal geography and the impacts of climate change.
|