Click/select to add your heading 1 title
Monitoring Monday – Data Quality Indicators
Join us Mondays as the Clean Water Team shares information and resources on watersheds and water quality monitoring. This Monday is about data quality indicators (DQIs).
Data are never free of error and always have some level of uncertainty. Uncertainty is most easily defined as the sum of all errors introduced in a measurement. In water quality sampling projects, error can be introduced as early as the sampling design phase and continues to be added at each stage of monitoring: from the sample collection, preservation and handling, to the analytical measurement and the data record in the database and report. Uncontrolled error can have a significant impact on the results and can lead to decision-making errors and data that are not supportive of the project’s goals. Therefore, it is important for the program to set limits on the allowable range of error, given the intended use(s), and, in turn, communicate those limits to the data users and decision makers.
Data quality indicators (DQIs) are the quantitative measures and qualitative descriptors used to set limits of acceptable levels of data error. The principal data quality indicators are precision, accuracy/bias, comparability, completeness, and representativeness.
The quantitative measures include precision, bias, and sensitivity, while accuracy (in general), representativeness, and comparability are qualitative descriptors. Completeness is unique and can be described by both quantitative measures and qualitative descriptors.
DQIs are used to specify certain measurement quality objectives (MQOs). Each monitoring project’s MQOs are designed to evaluate and control various phases (e.g., sampling, transportation, preparation, analysis) of the measurement process to ensure that total measurement uncertainty which, if achieved, will provide an indication that the resulting data are valid.
|
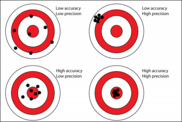
The terms accuracy, repeatability, reproducibility, and precision might appear to all be mutually inclusive. However, there are distinct differences between the terms, making it important to understand what each one means and its relation to the others.
Accuracy
Accuracy is the measurement of how close results are to a true or expected value. The smaller the difference between the measurement of a parameter and its "true" or expected value, the more accurate the measurement. Accuracy can be determined by comparing your analysis of a standard or reference sample to its actual value.
- Accuracy may be determined by calculating the difference between the average value from the true value.
Precision
The precision of a measurement describes how close the agreement is between multiple measurements. For example, if a piece of lumber is measured twice, the resulting value may vary slightly due to user error and the limits of the measuring device. If the two values are close together, then the measurement was said to have a high degree of precision. The application of precision can be further applied to two categories: reproducibility and repeatability.
- Precision may be determined by calculating the standard deviation, or relative percent difference, among samples taken from the same place at the same time.
Repeatability is the measure of the likelihood that, having produced one result from an experiment, you can try the same experiment, with the same methods and instruments, and produce that exact same result.
Reproducibility is the measure of how close multiple measurements agree, while using the same measurement process among different instruments or operators.
|
Bias
Bias is a systematic or persistent distortion of a measurement process that causes errors in one direction. Bias is acknowledged and corrected by laboratory staff when using reference materials or analyzing spiked matrix samples. Sources of bias that can be introduced into analytical systems and methods include systematic error, matrix interference, and contamination. These sources of error can be controlled through quality assurance practices (e.g., calibration). Quality control check samples (e.g., using reference materials and blank samples) are used to verify that bias is not present.
Systematic errors result in consistent bias, such as when an instrument consistently shifts the value in a predictable way, or an analyst performs a procedure in a way that consistently shifts the value.
Another source of bias may come from the sample matrix itself, where chemicals or conditions within the environmental sample interfere with the measurement.
|
Representativeness
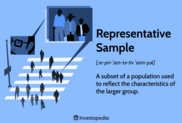
Representativeness is the extent to which measurements correctly represent the environmental condition, target organism population, and/or watershed to be studied. Representativeness itself cannot be directly confirmed. However, careful study design, sample site placement, and seasonal considerations can strengthen a project’s representativeness.
|

Completeness
Completeness refers to the comparison between the amount of valid data originally planned to be collected, and the actual quantity collected.
Completeness is commonly expressed as the percentage of reported measurements that meet DQOs compared with the number of projected quality measurements.
|
Comparability
Comparability expresses the measure of confidence that one dataset can be compared to and combined with another for a decision(s) to be made.When projects utilize similar methodology, data reporting and units, have similar expectations for the level of quality needed, and document and provide similar amounts of metadata and quality assurance information, the data from multiple projects can be combined for decision-making purposes.
|
RESOURCES & REFERENCES
Video Playlist: QA/QC for Water Monitoring Projects https://youtube.com/playlist?list=PLvTjRb8VCkp6jwlWmEbOOwg5TNBQ_emJP&si=bOL4W7_9q9wqdSlT
WARNING Some Assembly Required: Best practices for community water science groups https://youtu.be/AB2lDTnOfho?si=whrpsAp8g8qoe1wA
Quality Assurance Plans Made Easy https://youtu.be/JN-fvSiSVXM?si=cxMWrw6-r5nrDU72
SWAMP Quality Control and Sample Handling Guidelines https://youtu.be/iZdyJxCe73o?si=Wp0X2acjriZxoV_d
SWAMP Fecal Indicator Bacteria MQOs Update https://youtu.be/IL8EHou1oZ0?si=xGyUHIa3mmxua6cv
EPA Quality Program
EPA is committed to the collection, production, evaluation, and use of environmental information of known and documented quality. Incorporating quality assurance improves EPA’s policy-making and analysis and helps drive reliable, cost-effective, and legally defensible decisions all while preventing unacceptable environmental and human health risks to individuals and communities. https://www.epa.gov/quality
- EPA - Guidance for Data Quality Assessment
Demonstrates how to use data quality assessment in evaluating environmental data sets and illustrates how to apply some graphical and statistical tools for performing DQA. https://www.epa.gov/quality/guidance-data-quality-assessment
- Quality Assurance, Quality Control, and Quality Assessment Measures
Water: Monitoring & Assessment https://archive.epa.gov/water/archive/web/html/132.html
- QA Handbook Vol II, Section 3.0
Data Quality Objectives https://www3.epa.gov/ttnamti1/files/ambient/pm25/qa/vol2sec03.pdf
- Data Validation and Laboratory Quality Assurance in EPA's Pacific Southwest (Region 9)
EPA's Pacific Southwest (Region 9) implements and enforces federal environmental laws in Arizona, California, Hawaii, Nevada, the Pacific Islands, and 148 tribal nations. https://www.epa.gov/quality/r9-data-validation-lab-qa
- The Volunteer Monitor's Guide to Quality Assurance Project Plans
Developing a QAPP is a dynamic, interactive process that should ideally involve quality assurance experts, potential data users, and members of the volunteer monitoring project team. It is not an easy process. This document is designed to encourage and facilitate the development of volunteer QAPPs by clearly presenting explanations and examples. Readers are urged to consult, as well, the additional resources listed in the appendices to this document, and to contact their state or U.S. Environmental Protection Agency (EPA) Regional quality assurance staff for specific information or guidance on their projects. https://www.epa.gov/sites/default/files/2015-06/documents/vol_qapp.pdf
- Quality Assurance Handbook and Toolkit for Participatory Science Projects
Quality Assurance Handbook and Guidance Documents for Citizen Science Projects https://www.epa.gov/participatory-science/quality-assurance-handbook-and-toolkit-participatory-science-projects - guide
USGS Manage Quality
Data-quality management is a process where protocols and methods are employed to ensure that data are properly collected, handled, processed, used, and maintained at all stages of the scientific data lifecycle. https://www.usgs.gov/data-management/manage-quality
Quality System
The State Water Resources Control Board has prepared documents that are used in our Quality System. They consist of the Quality Management Plan (QMP) which is the overall Quality Assurance (QA) plan for the entire State Water Resources Control Board; Quality Assurance Program Plans (QAPrP), e.g. SWAMP's QA Program Plan; and numerous Quality Assurance Project Plans (QAPP). https://www.waterboards.ca.gov/water_issues/programs/quality_assurance/
The SWAMP (Surface Water Ambient Monitoring Program) Information Management and Quality Assurance Center (SWAMP IQ) is tasked with assisting ambient monitoring projects and programs throughout the state. We offer resources that support each stage of water quality monitoring, from sample collection to data entry, as well as providing quality assurance review, verification, and data storage. SWAMP IQ staff strives to promote question-driven monitoring, and to ensure the highest quality data is used to evaluate the health of California’s water bodies. https://www.waterboards.ca.gov/water_issues/programs/swamp/swamp_iq/
- SWAMP - Quality Assurance
A key component of the Surface Water Ambient Monitoring Program (SWAMP) is the development, implementation, and maintenance of the monitoring infrastructure (e.g., indicators, methods, quality assurance/quality control [QA/QC], and data management) necessary to support a robust monitoring program while also fostering data comparability and collaboration with monitoring partners. This page provides access to those tools. https://www.waterboards.ca.gov/water_issues/programs/swamp/quality_assurance.html
Clean Water Team - CWT - Quality Assurance/Quality Control (QA/QC)
The Clean Water Team has QA/QC resources and assistance available in its Technical Support Section
Some of the most useful are items for QA/QC are contained within:
Handbook for Analytical Quality Control in Water and Wastewater Laboratories https://www.epa.gov/quality/handbook-analytical-quality-control-water-and-wastewater-laboratories-march-1979
How To Measure Accuracy and Precision in 5 Steps https://www.indeed.com/career-advice/career-development/how-to-measure-accuracy
River Network - Quality Control and Quality Assurance
If you want your monitoring efforts to be successful, you should have a Quality Assurance Project Plan (QAPP). A QAPP includes your monitoring plan, standard operating procedures (SOPs) for your monitoring methods, and all quality assurance measures to ensure proper data collection. https://www.rivernetwork.org/our-impact/how-we-help/providing-science-support-2/science-and-technical-resources-portal/monitoring-data-production/quality-control-and-quality-assurance/
|