Nearly 100% of the State’s Disadvantaged
Communities Receive Investments
SACRAMENTO - A new report details the dramatic growth last year in Cap-and-Trade investments
that are reducing greenhouse gas emissions while strengthening local economies
and improving public health and the environment across the state, especially in
disadvantaged and low-income communities.
More than $720 million in new funding last
year went to projects that were either under way or completed across all of
California’s 58 counties, a two-thirds increase in implemented investments. From
rebates for electric cars to affordable housing units, completed projects
totaled 75,000, including doubling the number of home energy efficiency installations
and nearly tripling the number of trees planted.
The report tracking the progress of California
Climate Investments was released today by the California Air Resources Board
(CARB) and the California Department of Finance.
Signed by Governor Edmund G. Brown Jr. in July, Assembly Bill 398 extended and improved the state’s world-leading Cap-and-Trade
program to ensure California continues to meet its ambitious climate change
goals and that billions of dollars in auction proceeds keep flowing to
communities across the state through California Climate Investments.
“The investment of Cap-and-Trade proceeds is an
important part of the state’s overall climate efforts, reducing
climate-changing gases and improving quality of life especially in the state’s
most vulnerable communities,” said CARB Chair Mary D. Nichols. “California
communities across the state are reaping the fruit of these investments in better
air and improved transit. Governments around the world are looking to
California as a model for how protecting the environment can strengthen their economies.”
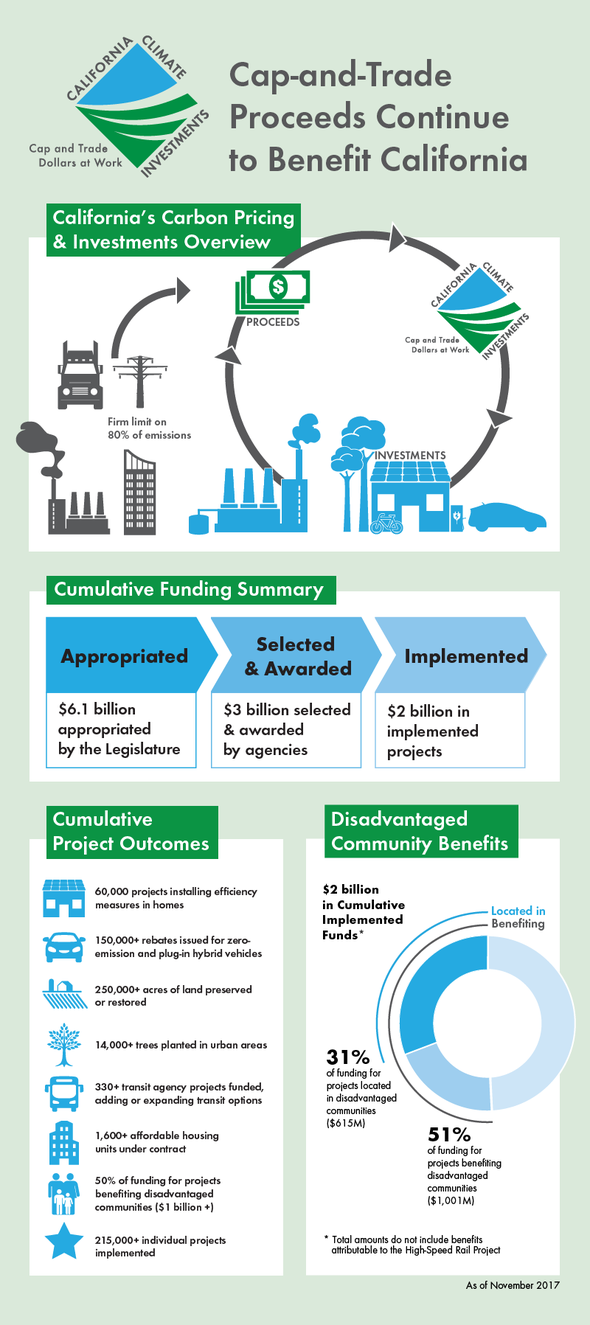
Since 2014, $6.1 billion
has been appropriated to 17 state agencies that have distributed $2 billion to
projects that are completed or under way. Agencies have awarded more than 80
percent of funds appropriated before September 2017. Additionally, implemented
funds (not including the High-Speed Rail Project) have attracted over $8.2
billion from other sources representing an average of nearly $6 leveraged for
every dollar invested.
Among the projects:
- A 44-unit
affordable housing development in Tulare County with integrated vanpooling
service and discount transit passes is among more than 1,600 housing units
funded statewide.
- The Cecchini
Farm in Contra Costa County, whose fifth-generation owners decided not to
sell after they were approved for a conversation easement, is among more
than 250,000 acres of land statewide that will be preserved, from coastal
watersheds and wetlands to mountain meadows.
- Los Angeles County’s
Foothill Transit is purchasing 15 zero-emission electric buses to advance
the agency’s goal to go all-electric by 2030 to reduce GHG emissions and
improve air quality in the inland communities it serves.
In California’s forests, California Climate Investments are
protecting more than 1.4 million acres, funding projects to reduce fire risk,
limit loss of life and property damage, and lower the cost of fighting
wildfires. More than 14,000 trees have been planted to provide shade and limit the
heat island effect in urban areas from Oakland and Stockton to San Bernardino
and Los Angeles counties.
Grants to farmers, businesses and individuals for more
water-efficient technology will not only cut greenhouse gas (GHG) emissions but
save more than 370 billion gallons of water throughout the state. And more than
150,000 rebates for zero-emission and plug-in hybrid cars are expected to
reduce over 5,000 tons of criteria and toxic air pollutants in addition to GHG
emissions.
The report features profiles that highlight
the impact these investments are having on individuals and communities,
particularly those in California’s most disadvantaged communities.
Benefits to Disadvantaged Communities
Fifty-one percent of the $2 billion in
implemented projects ($1 billion) is providing benefits to disadvantaged communities, including 31 percent ($615 million) going to
projects located within these communities. This exceeds the requirement under
SB 535 (De León) that at least 25 percent of investments are allocated to
projects that benefit disadvantaged communities.
The report also found that projects are underway in 98
percent of the 2,000 census tracts in the state that the California
Environmental Protection Agency designated as disadvantaged. And state agencies
are actively working to make investment opportunities more accessible to
disadvantaged communities through technical assistance grants and increased
outreach.
In 2016, Governor Brown signed AB 1550 establishing new
investment minimums for disadvantaged communities, and low-income communities
and households. The Legislature directed the 2019 Investment Plan to allocate
funding in accordance with AB 1550. In 2017, CARB released guidance to help
administering agencies to begin implementing AB 1550. Future reports will include AB 1550 outcomes
as agencies implement more funding.
Reducing Greenhouse
Gas Emissions
Projects funded to date are expected to reduce GHG emissions
by more than 23 million metric tons of carbon dioxide equivalent (CO2e),
roughly the equivalent of taking four million cars off the road for a year. In
addition, the High Speed Rail Project is estimated to reduce GHG emissions by
almost 59 million metric tons of CO2e over its operating life.
The report includes detailed information on
cost-effectiveness and metrics for evaluating program effectiveness. It also
includes new statistics and information on co-benefits quantified to date and
an update on plans for more comprehensive future reporting.
Accompanying the report is an updated interactive
map that allows users to track where Cap-and-Trade
funds are being invested across in the state. Users can view the locations of
individual projects and aggregate them by program and by the state’s 120
legislative districts and 58 counties.
Project-level data for all projects included in the 2018 Annual
Report and featured on the interactive map is available on the California Climate Investments website, including project locations, GHG reductions and benefits
to disadvantaged communities.
More Information
|