| |
|
Latest Vital Signs Update Highlights Trends in Housing Affordability, Poverty, and Other Equity Indicators
|
|
The Metropolitan Transportation Commission and Association of Bay Area Governments (MTC/ABAG) recently released updated data for five equity indicators on Vital Signs. Findings from the latest data on jobs by wage level, housing affordability, displacement risk, migration, and poverty were all published earlier this month.
|
Learn more: Jobs by Wage Level
|
|
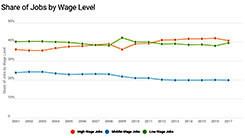
LESS THAN ONE-FIFTH OF JOBS IN THE BAY AREA ARE MIDDLE-WAGE
The number and share of middle-wage jobs has declined since 2001, despite overall job growth in the region. In 2017, fewer than twenty percent of all jobs in the region were middle-wage jobs earning between 80% and 120% of the regional median hourly rate. Meanwhile, employment in low- and high-wage work has increased, furthering the trend of wage polarization.
|
|
Learn more: Poverty
|
|
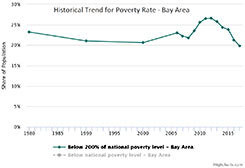
POVERTY IN THE REGION AT ITS LOWEST POINT SINCE 1980
The share of Bay Area households with incomes below twice the national poverty rate peaked during the Great Recession and has been declining since 2012. In 2017, the share of Bay Area residents in poverty dipped below 20% for the first time since 1980, a new low for the region.
|
|
Learn more: Housing Affordability
|
|
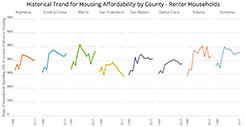
SAN FRANCISCO’S SHARE OF COST-BURDENED RENTER HOUSEHOLDS HITS NEW LOW
While the share of renters excessively burdened by housing costs has generally increased across Bay Area counties since 1980, San Francisco renters have followed a different trend. In 2017, 28 percent of renter households in San Francisco were excessively burdened by housing costs, the city’s lowest share on record. This trend is largely powered by rising incomes for renter households, as high housing costs lead many lower-income renters to seek cheaper housing outside of San Francisco.
|
|
Learn more: Displacement Risk
|
|
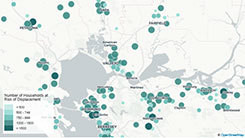
THE SHARE OF RESIDENTS AT RISK OF DISPLACEMENT PEAKS IN 2017
Displacement risk, or the share of lower-income households living in neighborhoods with declining lower-income populations, peaked in 2017. Displacement risk in jurisdictions in the North Bay and along the delta continued to rise in 2017. Cities like Vallejo and Antioch, once seen as affordable options for those that have been displaced, saw a growing number of residents at risk of displacement.
|
|
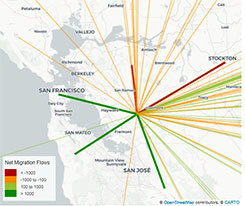
Learn more: Migration
|
|
THE EAST BAY SEES THE LARGEST NET OUT-MIGRATION OF RESIDENTS
7,400 more residents moved from the East Bay to counties outside of the region than made the opposite move. Of those, over 4,000 moved to San Joaquin County. This suggests that the East Bay, once seen as a more affordable option for housing in the Bay Area, is also becoming too expensive for many residents, leading them to seek cheaper housing outside of the region.
|
|

Take the survey: Vital Signs User Feedback Survey
|
|
HELP VITAL SIGNS EVOLVE TO BETTER SUIT YOUR NEEDS
MTC/ABAG is interested in learning more about how users interact with Vital Signs. We invite you to take our three minute survey to provide information about how you use Vital Signs and what you would change to make the site more helpful to you. Your responses will inform changes to the look, feel, and functionalities of Vital Signs over the coming years.
|
There is plenty more to explore on Vital Signs, including a new feature where users can delve into forecasted future conditions for the Bay Area generated as part of MTC/ABAG’s Horizon initiative. On the Horizon pages, users can learn more about the Bay Area of 2050 for each of the three Horizon futures and vote on strategies to address the challenges posed by each future.
Check out the Horizon pages on Vital Signs
|
|
|