|
Today the Metropolitan Transportation Commission and Association of Bay Area Governments (MTC/ABAG) released the latest data for road fatalities and injuries from crashes on Vital Signs, the Bay Area’s comprehensive performance monitoring website.
|
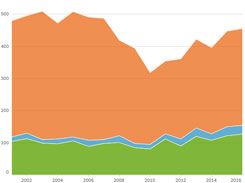
Compare trendlines for fatalities and injuries on the regional and county levels with interactive charts.
|
|
FATALITIES AND INJURIES FROM CRASHES ON THE RISE
There were 455 fatalities from crashes and 2,089 injuries from crashes in 2016, representing 43 percent and 25 percent increases from 2010, respectively. As our region’s economy has boomed, the number of fatalities and injuries has grown faster than both vehicle miles traveled and population growth.
|
|
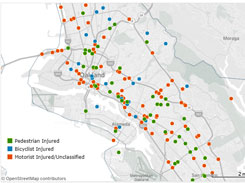
Locate crashes that resulted in pedestrian, bicyclist, and motorist fatalities and injuries using updated crash maps.
|
|
BICYCLISTS AND PEDESTRIANS ARE A GROWING SHARE OF FATALITIES AND INJURIES
Although roads have become increasingly safe for motorists, bicyclists and pedestrians account for a disproportionately large share of road fatalities and injuries. While improved vehicle safety technologies have managed to reduce fatalities among vehicle occupants, vulnerable non-motorized travelers have experienced higher fatality levels than in decades past.
|
Learn more:
Fatalities from Crashes | Injuries from Crashes
In the coming months, Vital Signs will release additional datasets on a rolling basis. Updates will include the latest data on transit infrastructure, housing production, and commuting trends.
Check out the Vital Signs website
|