|
Last week we sent an email with highlights of Alameda's transportation work in 2023, plus our draft 2024 work plan. These were from the recently-published draft Transportation 2023 Annual Report & 2024 Work Plan (p.65).
The annual report also includes the latest data on transportation trends in Alameda. Highlights are below, along with opportunities to get involved:
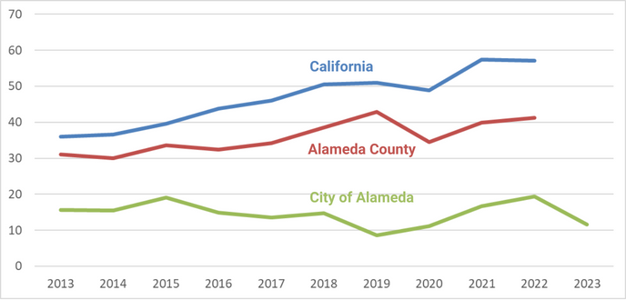
In 2023, three people died and six were seriously injured in traffic collisions on Alameda streets. Details about these crashes are in the Vision Zero Annual Report. along with information like the below:
- As of 2022, the City’s rate of traffic fatalities + severe injuries per 100,000 population was 54% lower than the rate in Alameda County as a whole.
- 19 of the 20 intersections improved in 2023 were on High Injury Corridors.
- 75% of Police Department traffic enforcement stops in 2023 were on High Injury Corridors.
Traffic Fatalities + Severe Injuries, Rate per 100,000 Population
Active transportation 2023 performance measure findings include:
- Alameda gained 3.3 miles of bikeways in 2023. We now have almost 57 miles of bikeways, including 22.5 miles of low-stress facilities.
- Limited, single-day counts done at seven intersections across Alameda over six years found a 57% increase in bicycling, with major increases at the Cross Alameda Trail.
- Census data for commuting trips shows bicycling going up slightly, walking decreasing slightly, and driving alone decreasing.
See the Active Transportation Performance Measures Annual Report for details.
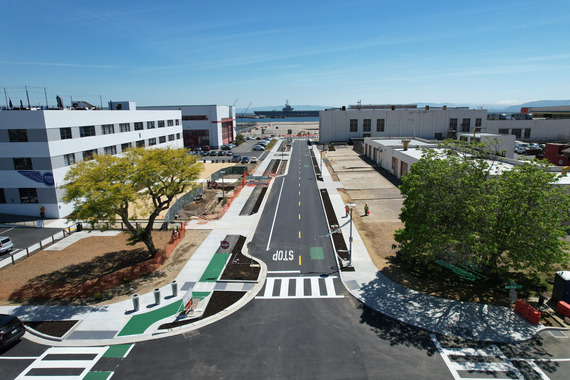 New walking and biking facilities on Saratoga St in Alameda Point. Photo by Maurice Ramirez
-
AC Transit ridership in Alameda grew slightly in 2023, with an average of 12,500 boardings per day on fall weekdays (which extrapolates to over 3 million weekday boardings in 2023)
-
San Francisco Bay Ferry ridership on the Seaplane Lagoon and Harbor Bay routes grew 46% over 2022 levels with more than 530,000 boardings on those routes in 2023.
Weekday motor vehicle travel on Alameda County freeways saw the trends below. (While none of Alameda County's freeways are in the City of Alameda, these are still useful metrics.)
- Average daily vehicle miles traveled surpassed pre-pandemic levels in 2022 and rose an additional 1 percent in 2023.
- Average daily vehicle hours of delay was still below pre-pandemic levels in 2023, but it increased by over 50% from 2022.
2023 Transportation outreach efforts by the numbers:
-
8 public workshops organized by transportation staff (not including commissions or City Council)
-
52+ presentations to City Council, City boards and commissions, community organizations, and ad-hoc committees
-
61 email bulletins sent, with 111,900 delivered and a 42% unique email open rate
-
41,000 unique pageviews on 36 webpages
-
15 Mastick Senior Center events to help seniors access transportation options
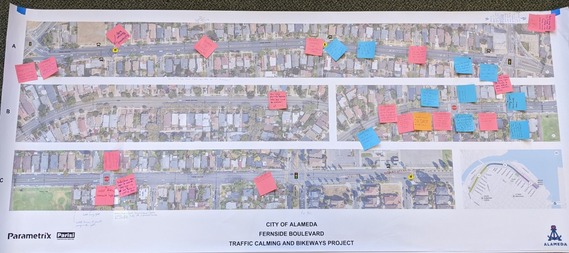 Public comments on sticky notes at a Fernside Blvd public workshop
The City Council is soliciting applications from residents who would like to serve on the Transportation Commission. Application forms may be completed and submitted on the City’s website or by contacting the City Clerk’s office at clerk@alamedaca.gov or 510-747-4800.
The Transportation Commission generally meets the fourth Wednesday of every other month at 6:30 p.m. It advises the City Council on City transportation plans, policies, programs, and capital projects. Adopted citywide transportation plans include the Active Transportation Plan, Mobility Element of the General Plan, Vision Zero Action Plan, and the Transportation Choices Plan.
The City Council is slated to review, discuss, and consider accepting this annual report, along with annual reports for the Climate Action and Resiliency Plan and the General Plan and Housing Element.
City Council meeting, March 19, 7:00pm
Contact us
transportation@alamedaca.gov
www.alamedaca.gov/transportation
Your Measure BB Transportation Sales Tax dollars keep transportation going in Alameda!
You are receiving this because you are signed up for a transportation-related City of Alameda mailing list.
|