|
Having trouble viewing this email? View it as a Web page.
|
|
|
|
|
Everything you want to know about transportation in Alameda is available in the new 2022 Annual Transportation Report & 2023 Work Plan! The City Council will review this report on March 21. This email newsletter contains highlights of the 2022 Transportation Facts; stay tuned next week for a newsletter focusing on work planned for 2023!
- In 2022, two people died and 13 were seriously injured in traffic collisions on Alameda streets. Compared to the last couple of years, this represents a decrease in fatalities but an increase in serious injuries, specifically to people in motor vehicles. 14 out of the 15 severe and fatal crashes occurred on roads that have not received major safety improvements.
- As of 2021, the City’s rate of traffic fatalities + severe injuries per 100,000 population was 51% lower than the rate in Alameda County and 66% lower than the California rate.
- In 2022, safety improvements were made at over 113 intersections, nearly 70% of which were on High Injury Corridors. Improvements included rapid flashing beacons, curb extensions, new/upgraded crosswalk markings, and daylighting. An additional set of intersections received signal upgrades like Leading Pedestrian Intervals (now installed at 68 of 89 signals).
- In 2022, 76% of Police traffic enforcement stops were on High Injury Corridors, with officers prioritizing efforts on dangerous streets.

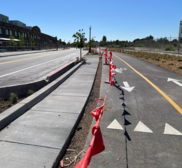
Alameda added 1.7 miles of bikeways in 2022. The City now has 53.6 miles of bikeways, including 22 miles of low-stress facilities.
The Cross Alameda Trail is now over 70% complete.
|
- Bus ridership continued increasing in 2022, and average daily boardings on AC Transit bus lines serving Alameda were 60% higher than in 2020. However, 2022 ridership on these lines was still 45% lower than in 2019, before the pandemic began.
- The Alameda Free AC Transit Bus Pass Pilot Program, which serves people with disabilities and low-income people age 65+, had 199 active users taking over 5,900 trips per month by the end of 2022.
- Across its system, WETA’s ferry service has achieved 65% of pre-pandemic weekday ridership and 100% pre-pandemic weekend ridership. Ridership on Alameda routes increased 103% over the course of 2022, led by the Seaplane Lagoon terminal.

- Alameda had 8% fewer registered motor vehicles in 2022 compared to 2017.
- Alameda County traffic increased: average daily Vehicle Miles Traveled was 7% higher across the County in 2022 compared to 2019. Despite that, average traffic delays still were 53% lower than in 2019.
- As of 2021, the City’s Pavement Condition Index is at the high end of “fair condition,” slightly above the Bay Area average and significantly better than the bordering cities of Oakland and San Leandro.
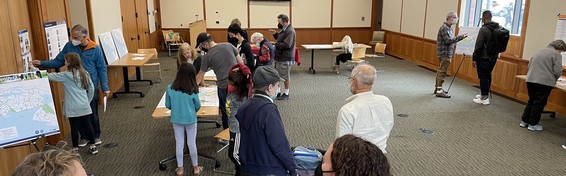
- In 2022, the transportation team organized 14 public events; sent 54 electronic mailings with 83,300 delivered and a 44% unique open rate (subscribe here!); and gave at least 78 presentations to City Council, City boards and commissions, community organizations, and ad-hoc committees.
- 2022 transportation positions were just over 8 FTE in total, but a transportation engineer position remained vacant despite a recruitment effort due to a regional shortage of transportation engineers.
The Bay Ferry 2050 Survey will close on March 24, and we hope Alamedans will share their thoughts about the future of ferry service in Alameda and the Bay Area.
|
|
|