COVID19 Updates From Health Care Services Agency
To read the full Health Care Services newsletter please visit: https://covid-19.acgov.org/response.page? .
For the most up-to-date information from Health Care Services, including progress made during Shelter-in-Place, information about COVID19 testing, and an update about how racial disparity continues to play a role in COVID19 cases and planning, visit the front page of the Alameda County Health Department website: https://covid-19.acgov.org/index.page?
================================================
An Update from Health Care Services: As of August 10, 2020
Last Friday, Dr. Mark Ghaly, Secretary of the California Health and Human Services Agency, announced an undercount of COVID-19 cases flowing to the California Reportable Disease Information Exchange known as CalREDIE. The issue, which began July 25, has since been addressed and the system is now performing as expected. We are told the current backlog was eliminated and new cases attributed to the backlog will be reported over the next few days. This means that Alameda County's trends for cases, testing, and positivity rates may still be subject to incomplete reporting. It's important to note that hospitalization rates are not affected as they are reported through different systems.
There are several notable leadership transitions to report this week including:
Drs. Moss, Clanon, and Stacey are coordinating to facilitate a smooth transition in close partnership with HCSA leaders and our COVID-19 team.
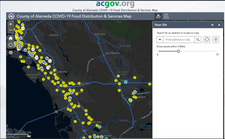
As we head into high temperatures forecast for Alameda County beginning this weekend, we want to remind you to stay hydrated and check in on vulnerable neighbors. The Alameda County Office of Emergency Services (OES) coordinates a list of extreme heat cooling centers which are currently limited due to COVID-19 considerations. OES is continually updating the list as new locations are submitted. This is also a good time to share the Alameda County Heat Vulnerability Map which illustrates social and environmental factors that contribute to community heat vulnerability and identifies neighborhoods and demographics disproportionately affected by heat waves. The interactive map illustrates the interconnected environmental, demographic, and health factors that can increase heat vulnerability of our communities. This information may be useful to county departments, city planners, and neighborhood and community organization efforts to assess and respond to the impacts of extreme heat.
Each week we provide a digest of new information on the evolving nature of the COVID-19 pandemic along with emerging and relevant news. We hope you find this summary useful, and we appreciate your readership and support!
|