COVID-19 Alaska Weekly Case Update: Oct. 11- 17, 2020
Alaska Department of Health sent this bulletin at 10/22/2020 08:22 PM AKDT
Alaska Department of Health and Social Services Weekly Case Analysis
October 11-17, 2020
Brief status report
- Transmission continues to increase in Alaska.
- Hospitals continue to see a steady rate of cases with currently 4.68% of the hospitalized patients being hospitalized for COVID.
- Test positivity continues to rise across most parts of the state, suggesting more testing is needed.
- It is vitally important that Alaskans get tested at the first sign of any symptoms. Testing is our best tool for understanding virus transmission and risk in our communities and to empower individuals to prevent the spread of COVID to others.
- Most Alaskans get COVID-19 from a friend, family member or coworker. Alaskans should wear masks, stay six feet from non-household members and avoid indoor gatherings.
Case trends and predictions
- For the third week in a row, more cases (1,294) were reported in Alaskans this week than any previous week. Alaska continues to see an acceleration in new cases.
- Positivity rates are rising in many areas across Alaska. The statewide positivity rate is at a record high for the third week in a row. Rises in positivity rate reflect that increases in testing are not keeping up with increases in cases.
- Cases are increasing in both urban and rural regions. The largest increases in case rates were in the Yukon-Kuskokwim Delta Region and the Interior Region excepting the Fairbanks Borough. The Northwest Region continues to have the highest two-week average case rate of any region of the state and again saw increases this week.
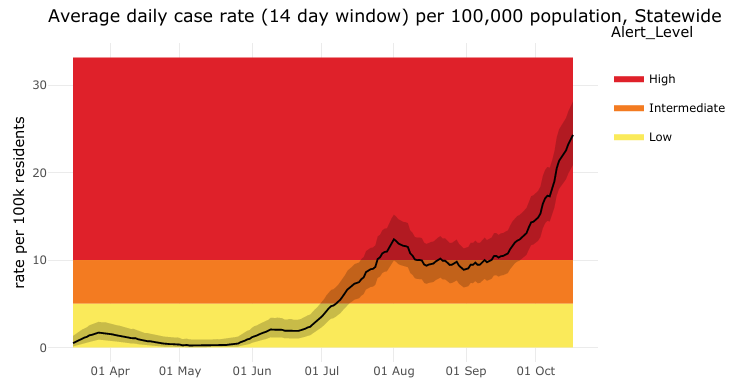
- The daily state case rate as of October 17 data is 24.3, up from 21.4 on October 10, a 14% increase. This number is cases per 100,000 people averaged over the last 14 days. The state alert level is high.
- Compared to other states’ case rates, Alaska’s average case rate per capita over the last 7 days (25.5 average daily cases over the last week per 100,000) is now the seventeenth highest of US states, just below New Mexico and worse off than Mississippi. If Anchorage were its own state, its 7-day case rate (31) would put it at rank #10, between Iowa and Arkansas. The Y-K Delta Region would be #4 with a 7-day rate of 44, between Montana and Wisconsin. Nationally, cases have been rising since mid-September, and increases have been seen in most states this week. 30 states currently have 7-day average case rates over 15 per 100,000, up from 26 last week.
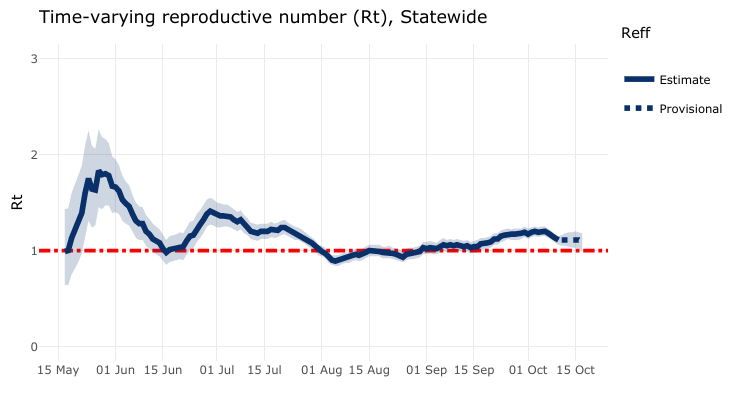
- The reproductive number, a measure of contagion, is currently estimated to be approximately 1.1. A reproductive number of 1 means that each person who is diagnosed with COVID-19 gives it on average to one other person, so this increase means that Alaskans with COVID-19 are spreading it more readily than they were two weeks ago. A reproductive number of more than 1 also means that the epidemic is growing, and the goal is to have enough people wear masks, stay at least 6 feet from others, and stay home and get tested when they are sick that Alaska’s reproductive number decreases to well below 1. Our reproductive number was below 1 as recently as late August.
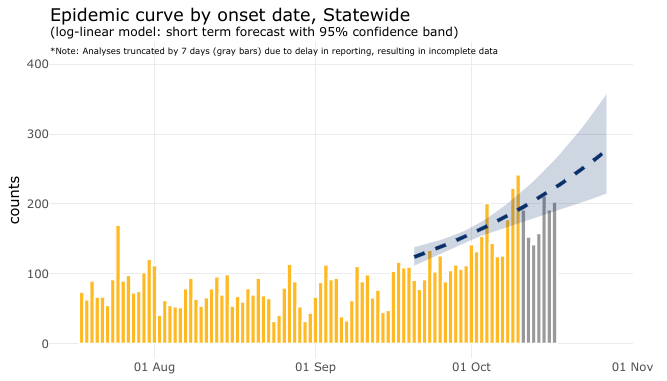
- An updated model epidemic curve predicts Alaska’s cases will continue to accelerate over the next week. As recently as three weeks ago, cases were now expected to double every 105 days, with a daily projected growth rate of 0.66%. Cases are now expected to double about five times as fast, around every 22 days with a daily projected growth rate of around 2.2%.
- Nonresident cases, which peaked in late July, decreased over August and currently average around 5 new nonresident cases identified per day.
- Alaska continues to have the fewest COVID-19 related deaths per capita of any US state, but now has more total deaths than both Vermont and Wyoming.
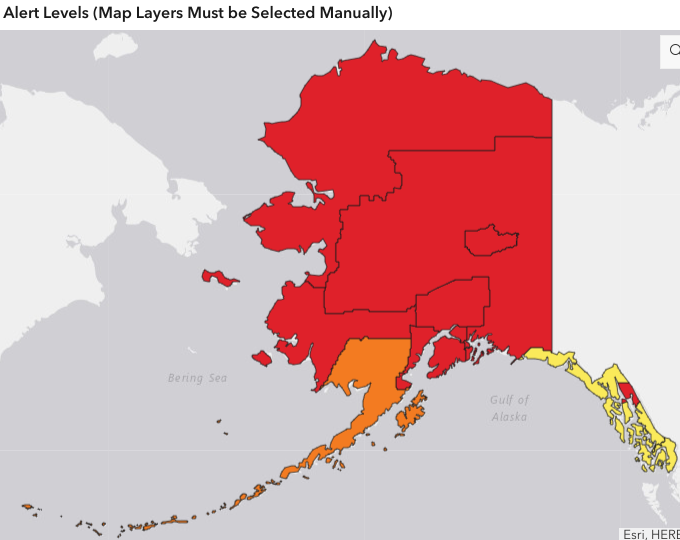
Regional trends
- Anchorage Municipality, the Northwest Region and the Y-K Delta Region all had substantial increases in case rates this week and continue to experience high levels of community transmission. The largest and most concerning acceleration seen was in the Y-K Delta Region, with a 67% increase in case rate from 22.3 to 37.2. Anchorage Municipality’s case rate increased by 11% from 28.9 to 32.2.
- Fairbanks North Star Borough remains at a very high case rate, 33.3, slightly decreased from 35.0 last week. This may be a true decrease or a factor of limitations in testing; as testing expands in Fairbanks more data should be available.
- Northwest Region increased by 10% from 35.7 to 39.1, remaining the highest rate of new cases of any borough reported.
- The Interior Region remained in the high alert level this week with an increase to 17.1 from 11.3.
- Mat-Su, Juneau and Kenai moved into the high alert level this week, with case rates of 11.5, 14.1 and 12.0, respectively.
- The Southwest region remains the intermediate alert level with a rise from 6.4 to 7.2.
- The Southern Southeast Region also saw an increase in cases this week but remains at the low alert level.
- The Northern Southeast Region saw a decrease in case rates this week and also remains at the low alert level.
Regional case trends
*Insufficient data; low case rate
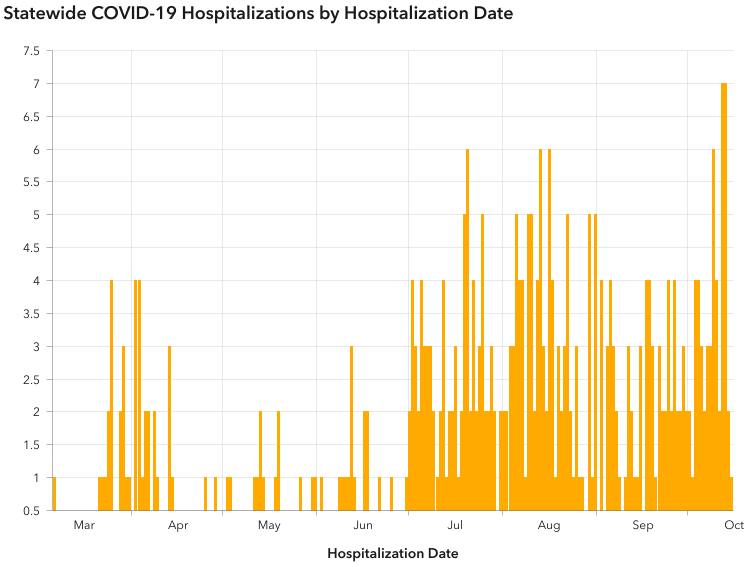
New cases, hospitalizations and deaths
- The week of October 11-17 saw 1,294 new cases in Alaskans, for a total of 10,980 cumulative cases in Alaskans.
- This is the highest number of new cases in one week ever reported in Alaska, for the third week in a row.
- Cumulative hospitalizations increased to 361 with 37 new this week.
- Deaths among Alaska residents increased by 3 to 67 total.
- There were 35 nonresident cases identified this week, for a total of 1036.
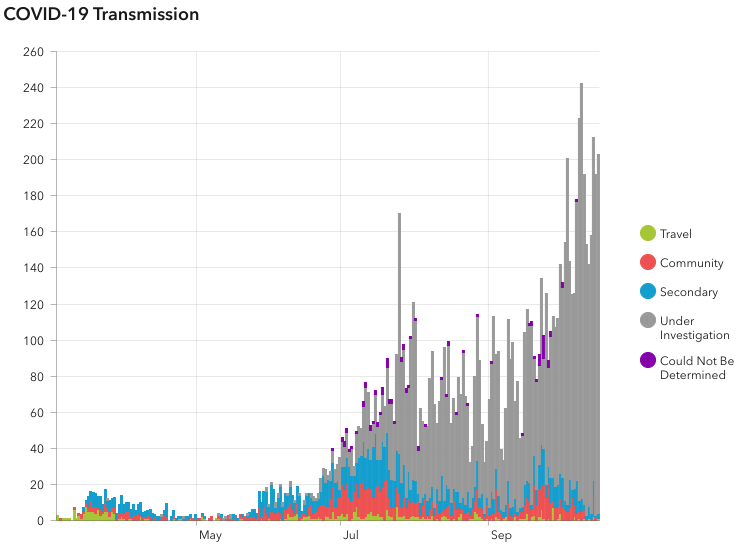
How COVID-19 spreads in Alaska
- Most new infections among Alaskans are from community spread, not from travel. Most Alaskans get the virus from someone they work, socialize, or go to school with.
- Many cases do not have a clear source, meaning that contact tracers have not been able to identify where the person got the virus. This means that there are cases in our communities that we do not know about.
- Many Alaskans who are diagnosed with COVID-19 report that they went to social gatherings, community events, church services and other social venues while they were contagious but before they knew they had the virus.
- The distribution of cases among people of different races and ethnicities has not changed significantly since last week.
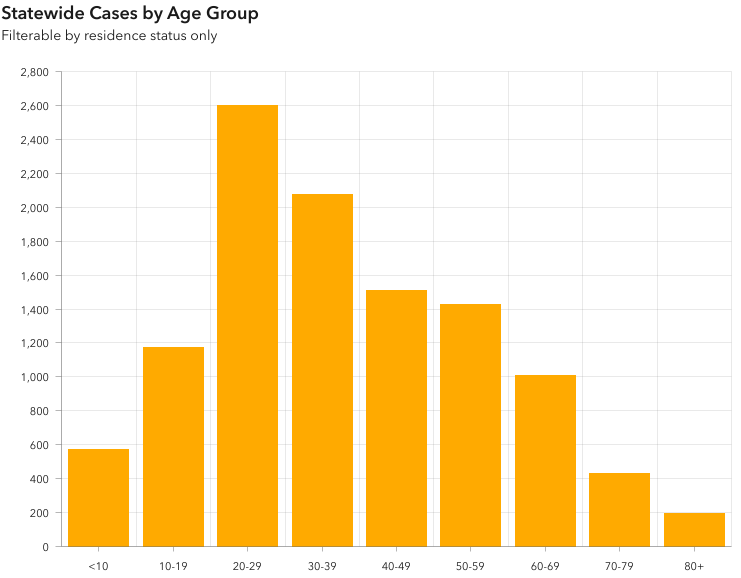
- Contrary to what has been seen in recent weeks, with the proportion of cases previously increasing most rapidly in Alaskans aged 10-39, the proportion of cases in Alaskans aged 40-69 increased slightly this week compared to previous weeks, although there were still higher numbers of new cases seen in Alaskans aged 20-39 than any other groups. This follows patterns seen in other states of increases in viral transmission occurring in younger age groups first, then followed by increases in older age groups, after which typically an increase in hospitalizations and deaths is seen.


Distribution of cases compared to population distribution and distribution of cases, hospitalizations and deaths by race and ethnicity
- Includes data from all cases reporting one or more races. Based on these data, American Indian and Alaska Native as well as Native Hawaiian and Pacific Islander populations are disproportionately affected. One factor limiting interpretation is that a greater proportion of tests from the Alaska Native Tribal Health system currently have race indicated than tests from other sources, which may mean that cases in Alaska Native People are more likely to be reported as such than cases in people who receive care through non-tribal health systems. However, this should not significantly impact Native Hawaiian and Pacific Islander population case counts.
- If race or ethnicity is not identified with the initial test, contact tracers will attempt to collect this information, but these data are often delayed resulting in many cases still labeled under investigation or unknown. Additionally, people who are hospitalized or have died with COVID-19 are more likely to have a race identified.
*Based on US Census Bureau 2019 estimates: https://www.census.gov/quickfacts/AK
**By federal convention, ethnicity is not mutually exclusive of race, so cases identifying Hispanic ethnicity are also counted under a race category.
***Reports the percent of cases of those for whom an ethnicity is known.
Distribution of cases compared to population distribution and distribution of cases, hospitalizations and deaths by age group
Includes data from all cases. For all ages, the percent of cases in that age group who have been hospitalized or who are deceased is either the same or decreased from last week. Hospitalizations and deaths tend to lag new cases by several weeks, so we expect to see case numbers rise (and percentages therefore fall) well before we see substantial increases in hospitalizations or deaths.
*Based on US Census Bureau 2019 estimates via Census Reporter: https://censusreporter.org/profiles/04000US02-alaska/
**Margin of error is at least 10% of the total value
Distribution of cases compared to population distribution and distribution of cases, hospitalizations and deaths by sex
*Based on US Census Bureau 2019 estimates via Census Reporter: https://censusreporter.org/profiles/04000US02-alaska/
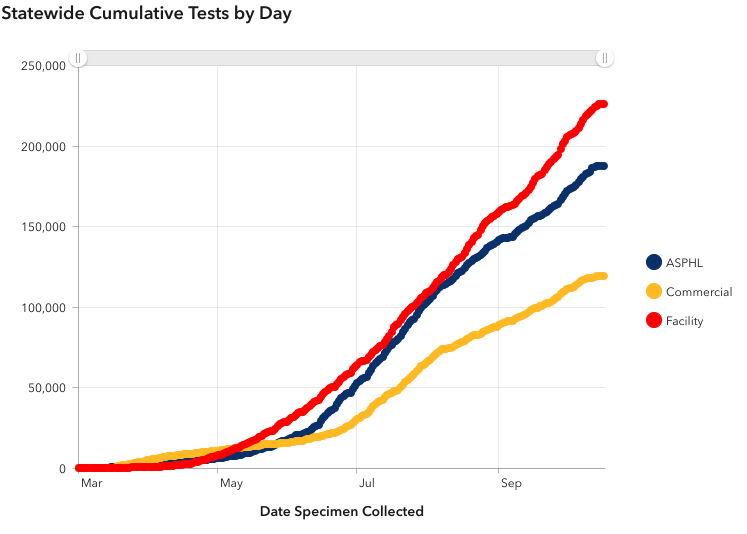
Testing trends
- Testing increased at a steady rate throughout May, June and July, slowed in mid-August, and is starting to increase again. The rising positivity rate is a clue that we are not increasing testing as quickly as cases are increasing, however. Over half a million tests have been performed so far in Alaska (532,711) and current laboratory turnaround times average 1-3 days.
- Alaska has the capacity to continue expanding testing. DHSS can assist in materials for setting up new testing sites and is pursuing all avenues for expanding testing.
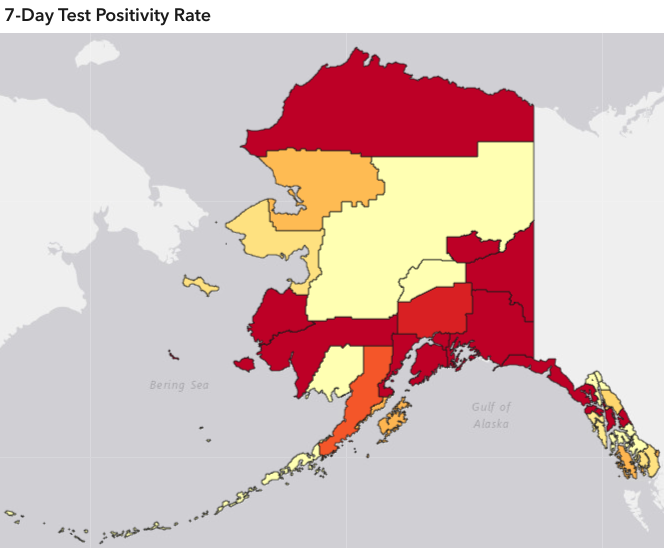
Positivity rates
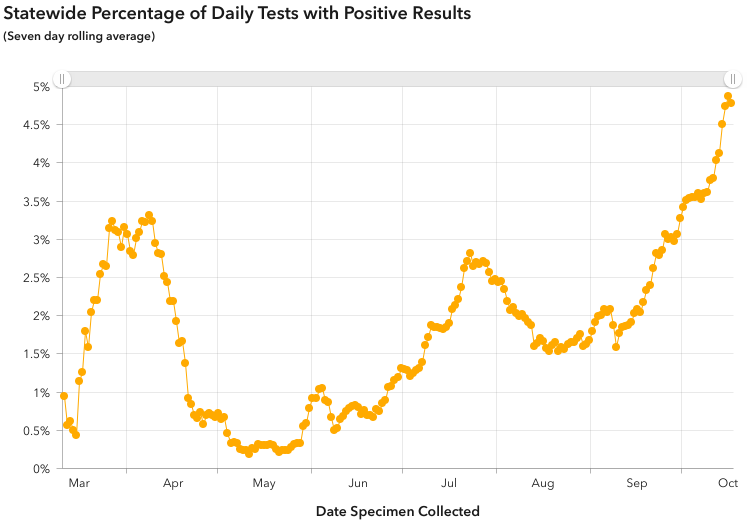
- The statewide test positivity rate went from 4.6% to 4.9% this week, which is the third week in a row that it is the highest it has ever been. Positivity rate is calculated by dividing the number of positive tests by the total number of tests performed over a given period of time, averaged over the past seven days. Statewide test positivity had not been above 3% since April, and had never before exceeded 3.5%, but has been climbing from below 2% in early September and the increase has accelerated.
- Currently, the national average is 5.3%. While many states have a higher positivity rate than Alaska does, this rise is concerning because the positivity rate is our best measure of whether our testing capacity can keep up with current cases. A rise in positivity rate reflects that testing is not increasing as fast as the current increase in cases. Since Alaska’s per-capita testing capacity is more robust than 90% of states, the finding that the positivity rate is nearing the national average is concerning. Source: Johns Hopkins
- The reported test positivity rate is currently highest in the North Slope Borough at 13.2%, increased from 6.3%, although is limited by being based on a smaller number of tests. Fairbanks North Star Borough improved to 7.0% from 11.8% last week. Anchorage Municipality has a test positivity rate of 5.9%, an increase from 5.0%. Other areas with high test positivity rates include the Valdez-Cordova Census Area (7.8%), Kenai Peninsula Borough (6.2%), Southeast Fairbanks Census Area (5.9%) and Bethel Census Area (5.5%). Yakutat plus Hoonah-Angoon reports an 8.7% positivity rate but this is based on a very small number of reported tests and the region case rate is fortunately low.
- Test positivity is a good measure of whether testing is adequate in a given area, since it is affected by the number of tests performed as well as the number of new cases in an area. However, because it depends so much on the number of tests performed, it tells us more about whether we are doing enough testing than about how much virus is spreading in a community. It cannot be used to compare the amount of virus spread in one state to another, but it can be used to compare whether different states are doing adequate enough testing to be able to measure their case rate. It is also affected by any delays in reporting, since positive tests are sometimes reported faster than negative tests. A case rate can give good information about how much virus is spreading in a community, as long as the test positivity is low, so these measures can work together to help us understand the spread of virus in a community. A community test positivity rate under 5% is currently generally accepted as being low enough to estimate that a community’s case rate is reasonably accurate.
- In late August, Alaska led the nation in most tests per capita and continues to be among the top 3 states in tests per capita. Alaska’s high testing rates likely affect our hospitalization and death rates, since in places where tests are restricted to people who are very ill, many asymptomatic or mildly symptomatic COVID-19 cases are missed. In Alaska, testing is somewhat more available in many communities than in many communities in the lower 48, so we may detect more COVID-19 cases relative to the real number of people with COVID-19 than in states that do less testing per capita. Hospitalization and death rates are calculated by dividing the number of people who were hospitalized or who died by the number of people in that group that were known to have COVID-19, regardless of the severity of their illness.
- We do not have a reason to believe that the strains of COVID-19 are any less virulent in Alaska than elsewhere; in fact, in the genetic studies done so far of COVID-19 strains circulating in Alaska, virus that was as virulent or more so than that circulating in the Western United States was identified. This means that the virus present in many communities in Alaska has the ability to make people of all ages very sick if it is allowed to continue to spread.
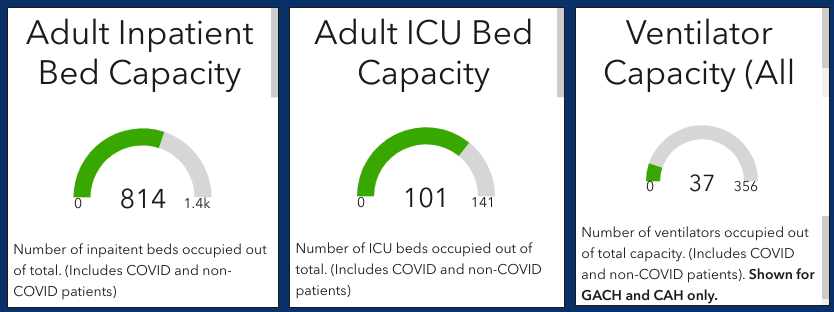
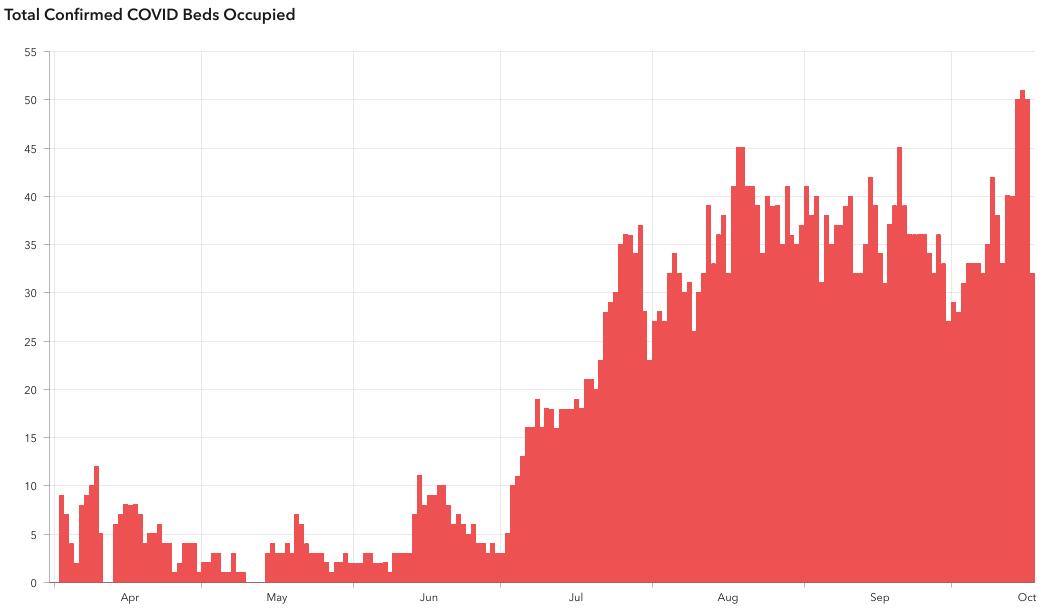
Health care capacity
- Hospitalizations hit record highs this week.
- Currently, 45 Alaskans with confirmed COVID-19 are hospitalized, as well as 28 with suspected COVID-19. 11 Alaskans with confirmed COVID-19 are currently requiring a mechanical ventilator. This week saw three days with 50 or more Alaskans hospitalized with COVID-19 at one time; the previous highest occupancy was 45, reached briefly in August and again in September.
- Hospital data includes inpatient beds and ventilators located all around the state, including some in smaller hospitals without ICU capacity. Hospital beds also do not necessarily represent staffed beds, as staffing can change quickly, particularly if a community has many health workers impacted by COVID-19.
COVID-19 and travel
- Travel is not currently thought to be a main factor in most new COVID-19 infections in Alaska, meaning that most Alaskans who get COVID-19 are getting it from social, work or family contacts rather than travel. New cases in nonresidents have diminished since summer peaks, averaging around five new cases per day over the last week, up from around three per day the previous few weeks.
- Testing in airports is now in its 19th week, with 340,131 passengers screened total, 12,406 in the past week. In the last week, 5,207 (43%) travelers tested prior to travel, 4,957 (40%) tested in the airport, 1,342 (11%) selected a 14 day quarantine and 900 (7%) traveled for fewer than 72 hours or followed another workplace and community protection plan. Of those tested in AK airports, 49 positive tests have been reported so far, a 1% positivity rate. Not all airports have completed reporting for the week so this number is preliminary and may rise. Since airport testing began, 169,411 (50%) of travelers have tested prior to travel, 106,649 (31%) have been tested in an airport in Alaska, 34,811 (10%) have selected a 14-day quarantine, and there have been 585 positive tests overall for an average positivity rate of 0.56%.


What Alaskans should do
- Anyone with even one new symptom of COVID-19 (fever, chills, cough, shortness of breath, difficulty breathing, fatigue, muscle aches, body aches, headache, new loss of taste or smell, sore throat, congestion, runny nose, nausea, vomiting, or diarrhea), even if it is very mild, should get tested for COVID-19 right away and immediately isolate themselves from others by staying home, staying away from others, and not leaving their house except to seek testing or other medical care. Tests are most accurate in the first few days of symptoms, so testing as soon as possible after the first symptom starts is important, even if the symptom is very mild. Getting tested right away also helps contact tracers move as quickly as possible.
- Alaskans can help contact tracers work to slow the spread of COVID-19 by answering the phone promptly and providing accurate information.
- Alaskans should avoid gatherings, wear masks when around any non-household member, keep six feet of distance from anyone not in their household and wash hands frequently to slow community transmission of COVID-19.
Further information
- The Frequently Asked Questions webpage at https://covid19.alaska.gov/faq/ is often the quickest route to an answer regarding testing, travel, health mandates and other COVID-19 information.
- Please see the State of Alaska COVID-19 information page at http://dhss.alaska.gov/dph/Epi/id/Pages/COVID-19/default.aspx for more information about the virus and how individuals and businesses can protect themselves and others from transmission.
- For the most up-to-date case information, see the Alaska Coronavirus Response Hub dashboard: https://coronavirus-response-alaska-dhss.hub.arcgis.com/. Some data may change as more information comes to light through contact tracing and other public health work.
- For questions regarding DHSS COVID response, including mandates and alerts, email covidquestions@alaska.gov.
- For DHSS media inquiries, please contact clinton.bennett@alaska.gov.
| STAY CONNECTED: | |||||
| |
|||||
SUBSCRIBER SERVICES:
Manage Preferences | Unsubscribe | Help
Update your subscriptions, modify your password or email address, or stop subscriptions at any time on your Subscriber Preferences Page. You will need to use your email address to log in. If you have questions or problems with the subscription service, please contact subscriberhelp.govdelivery.com.
This service is provided to you at no charge by the Alaska Department of Health and Social Services.