Floodplains
are low, flat lands along river and stream channels that periodically flood
with water and sediment.Floodplain
connectivity is the ability of water, sediment, and biological communities to
move freely between a river’s banks and its floodplain.When a river and its floodplain are in
balance, this represents a natural, stable river system. In simple terms, the
river is connected to its floodplain. In a stable river system, when water
flows above the banks, it is able to disperse excess velocity and sediment
across the floodplain (i.e., its valley).The floodplain is then able to “work its magic” by holding water and
filtering sediments, thus reducing flood damage and bank erosion downstream,
and keeping our rivers clean. Therefore, maintaining floodplain connectivity is
a critical component to maintaining river stability and natural floodplain
function.
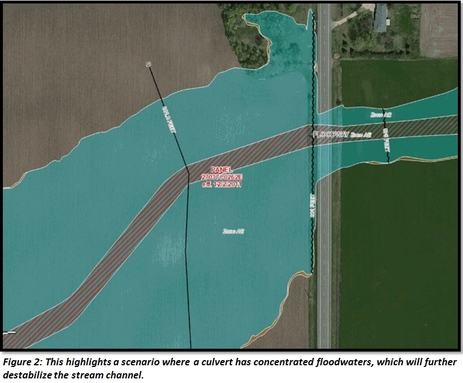
Changes
to floodplain connectivity are commonly caused by human activity, when
structures, fill, or undersized culverts are placed in a river’s
floodplain.When such obstructions are
introduced onto a river system, it often concentrates the swift-moving
floodwaters, which results in excessive erosion of the channel bed and banks.
Erosion along such unstable channels will continue until a balance is once
again achieved. This balancing act commonly requires decades, even centuries,
to re-achieve equilibrium introducing tons of sediment into the river system to
manage. The river system will naturally soften its gradient between the channel
and floodplain, taking acreage with it.
In an upcoming series of Water
Talk articles, we will address impact of improper roadway and culvert
design to floodplain connectivity. It is based upon both anticipated and
accomplished research on road/river intersection (e.g., bridges, culverts)
design. The Ecological and Water Resources (EWR) Division has been promoting an
approach to improve infrastructure (e.g., culverts, bridges, etc.) by
integrating local landform metrics into site design. Although on-going, our
findings and recommendations can be reviewed and accessed on our website at the
following link:
The national Association of State Floodplain Managers (ASFPM) worked with the University of Wisconsin Survey Center to prepare its first national survey of local floodplain administrators. In the next few weeks (in March 2016) the survey will be distributed randomly to 3,000 communities across the nation.
The survey should not take more than 30 minutes to complete.
Individual
responses will remain confidential. While the aggregate results of the
survey will become public, officials do not have to worry that their
personal information will be disclosed.
The survey effort should be completed by mid-May.
If you receive a survey from ASFPM or the University of Wisconsin on
floodplain matters, please respond. We'd like the input of our Minnesota
communities!
Time: Registration at 8:30. Sessions run from
8:45 am to 4 pm with an hour break for lunch. Two tracks will be offered for
most of the day so those attending can choose to cover basics or more advanced
topics.
Cost: FREE for training. At most
locations there will be an opportunity to order (and pay for) box lunches that
morning; bring cash or a bag lunch.
Target Audience: City, county and watershed
staff who administer shoreland ordinances, floodplain ordinances,
interpret FEMA flood maps, or determine flood elevations; or consultants,
surveyors, insurance agents, realtors, or others who work with these issues.
Feel free to forward to others who do work in mapped floodplain areas.
If you are interested in this training, please RSVP by the
date listed for the location you will be attending.Contact Matt Bauman at matthew.bauman@state.mn.us
or 651-259-5710. Late registrations or walk-ins are welcome, but
knowing the number of participants by the RSVP date will help us prepare.
Topics Covered:
History of floodplain management regulations, roles, definitions, & permitted uses in floodway vs flood fringe
If you've been to FEMA's Map Service Center Site - www.msc.FEMA.go - since December 13, 2015, you will see many changes in the way it appears.
The new home page looks very different. See the new look in Figure 3 (below).
The MSC page search functions are now on the left. Note that they are under search functions for the main FEMA web site.
Figure 3 - The new MSC home page
When
you do a search, the interactive icons are more prominently at the top.
See example in Figure 4 that includes the icon links for:
View Map
Save Map (as png file)
Interactive Map*, and
Show all
products for this area.
HINT - if the new site is not working for you, try cleaning your cache.
*Link
to the FEMA Flood Hazard Data Layer viewer; only available in counties
with Digital Flood Insurance Rate Maps, or DFIRMs, which is the format
that started in 2003.
Figure 4 - Icon links that you can see on the new FEMA Map Service Center site
You are the local floodplain manager. A resident contacts you and says that they are refinancing their mortgage and the bank is telling them they must purchase flood insurance. The bank told them to go to their local floodplain manager and get a copy of the elevation certificate and get the base flood elevation.
The house was built in 1960, and they haven't done any additions or big improvements, so you don't have any elevation information. You look at your FEMA Flood Insurance Rate Map (FIRM) and see the house is in an A zone, so there is not a BFE on on the map or in the Flood Insurance Study. BUT, you know there are models for the A Zones ("pink lines") in that area. You also see that the A Zone and the 2-foot contour elevations are not at all consistent. Based on the 2-foot contours, the house is about ten feet above where the floodplain appears to be.
What do you tell them? What are your options to help them?
Figure 5 - Site is partly in A Zone (light blue layers). "Pink lines" show estimated 1% annual chance flood elevations. Gold lines with numbers show 2-foot contour elevations.
See bottom of this Water Talk newsletter for answer.
Fifteen Years of Mitigation Action - Granite Falls, Minnesota
The City of Granite Falls has been working on flood
mitigation for 15 years. The funds secured and projects done over those years help
the city to be, as described by Mayor Dave Smiglewski, “better prepared for and
better protected against the inevitable high waters that occur in the river.”
The city has experienced 5 of its 10 highest flood events in
the last 19 years, including their largest flood, in April of 1997. After that
initial event, much of the city’s attention quickly turned towards rebuilding
and getting things back to normal.Not a
lot of attention was placed on mitigating the risk; after all, it was a
once-in-a-lifetime “500-year” flood. The second major event came four years
later in April of 2001, which is ultimately what triggered the city to
aggressively pursue mitigation efforts ever since. In the aftermath of just
these two floods, the total cost of clean-up alone for the city was nearly $1.3
million. Throw in a tornado that struck the city in 2000, and the city had all
the support they needed to get serious about hazard mitigation.
Since completion of the city’s initial flood hazard
mitigation plan, the city has secured nearly $40 million in funding from local,
regional, state, and federal sources. Funding partners over the years have included
the Minnesota Department of Natural Resources (MNDNR), the Economic Development
Administration (EDA), Federal Emergency Management Agency (FEMA), the Minnesota
Department of Employment and Economic Development (DEED), the Upper Minnesota
Valley Regional Development Commission, and Yellow Medicine County. Demonstrating
local commitment to flood mitigation has been an important part of the city’s
successful federal-state-local partnerships. Much of the city’s $600,000 contribution
has been provided through in-kind services and other non-monetary
contributions.
The
city began with an aggressive buyout program where they negotiated the
acquisition, demolition, and relocation of over 35 residential properties and
25 commercial buildings in the downtown area along the Minnesota River, as well
as along the overflow channel. The city also relocated their city hall
building, which was permanently moved in 2009.
Additional efforts included the construction of a flood
wall, the re-purposing of the Prentice Place Commons building, and a new water
treatment plant. Most recently, the city received an EDA grant in the amount of
$1.5 million, which was matched with a grant from the MNDNR, to relocate their
sanitary lift station out of the floodplain. According to Granite Falls Mayor
Dave Smiglewski, the lift station was one of the last of the big flood
mitigation projects that the city had taken on.
But not the last.That honor goes to the rehabilitation of the city’s signature pedestrian
bridge over the Minnesota River, which was mostly under water during the 1997
flood event.
Mitigating flood risk of a community takes time—sometimes a
decade or more—and can involve multiple costly projects. But the payoff of a
safer, more resilient place to live, work, and invest in the future is worth
every penny and all the effort. These efforts are more than just about saving
buildings, but rather preserving the services and tax base of those protected
areas. As explained by City Manager Bill Lavin, “I know for a fact that the
city’s tax-base is stronger than it was pre-flood.”
In Granite Falls, these efforts have significantly reduced
the number of structures in floodplain, and enabled the city to become a Class
5 member of FEMA’s Community Rating System, which provides residents and
property owners within the high risk flood hazard area a 25 percent reduction
on the cost of their flood insurance premiums.
Everything seems to be under control now in Granite Falls.
The city’s efforts have taken given the town a sense of confidence fighting
these floods.Mayor Smiglewski commented
in an interview during the 2011 floods: “It's a beautiful day; the river’s
high. It's kind of a tourist attraction.”
This article was provided by FEMA Region 5, but was modified for use in this newsletter. Photos provided by MNDNR Floodplain Program.
The Upper Mississippi River Conference traditionally has attendees from all the upper Mississippi River states, and has good representation from those in academia. See the Save the Date card and the Upper
Mississippi River Conference web site for more details.
Technical Mapping Advisory Council (TMAC) Update - 2016
The Technical Mapping Advisory Council (TMAC) was re-established* in
July 2014, to “review and make recommendations to the Federal Emergency
Management Agency (FEMA) on matters related to the national flood mapping
program.”This re-establishment was mandated as part of
the Biggert-Waters Flood Insurance Reform Act of 2012.
The 21 members of the TMAC form an advisory
committee consisting of acknowledged leaders in the technical fields of surveying,
cartography, remote sensing, geographic information systems, and other
professions associated with preparation and publication of Flood Insurance Rate
Maps (FIRMs). Beyond technical skills, the TMAC also seeks a balance of
Federal, state, local, and private members, and the geographic distribution of
members from across the nation.
TMAC’s mission is “to provide counsel to FEMA” and is
demonstrated through its five guiding principles: to use effective leveraging and efficient
implementation to help to ensure the financial
stability of the National Flood Insurance Program (NFIP), and assist in
producing credible products that will,
in turn, promote continued stakeholder
acceptance in the final mapping product. TMAC’s
goals include meaningful cooperation between local, state, and Federal
governments and their private sector partners, adequate and timely use of
funding, accurate modeling and risk assessments, and understanding of flood
risk by the public.
The TMAC Future Conditions Report, outlines
the TMAC’s effort to “consult with scientist and technical experts, other
Federal agencies, states, and local communities to develop recommendations on
how to ensure FIRMs incorporate the best available climate science to assess
flood risks, and that FEMA uses the best available methodology to consider the
impacts of the rise in sea level and future development on flood risk.” The
report details an extensive series of recommendations to FEMA for
implementation to accommodate our changing environmental conditions.
The 2015
Annual Report outlines the activities and accomplishments of the TMAC
through its first year. Included in the Annual
Report is a list of 22 recommendations in policy or regulatory practices, reflecting
nine topic areas that include:
Community of Users and Uses
Flood Hazard Identification - Program Goals and Priorities
Flood Hazard Identification - Core Data, Models, and Methodology
Flood Hazard Identification – Production
Processes
Flood Risk Assessment and Communication
Data Distribution and Management
Federal Partner Collaboration
Cooperating Technical Partners; and
Maintenance and Funding.
Recommendations of the TMAC will likely affect the
end user of NFIP products. The most probable suggestions that could have a
lasting impact on communities are recommendations that FEMA fully transition
from panel-based paper maps to a complete digital environment; structure-based
risk determinations; offer community-based incentives to reduce risk; and
increase the data partnerships with the states and local communities.
More information on the TMAC, a Frequently Asked
Questions flyer, and its publications may be found at TMAC’s web site.
* The original TMAC had been authorized in 1994 following the National Flood
Insurance Reform Act of 1994, but was only impaneled for a term of five years.
This article was provided by FEMA Region 5, but was modified for use in this newsletter.
Webinar
participation is free, but registration is required. Priority registration is
given to FEMA Regions 2, 5, 7, 9, and 10. Note: Minnesota is in FEMA
region 5.
NO SHOW
Policy: If you
cannot make the training, you must cancel 24 hours before the class is
scheduled. Failure to attend two or more classes without notice will affect
your eligibility to register for future classes.
CRS: Preparing for a Verification Visit, March 15 @ 12 pm (central)
How to get flood zones based on accurate data and boundaries
Editor's note: This article originally ran in the Association of State Floodplain Managers (ASFPM) December 2015 News & Views Newsletter. It was written by Ceil Strauss for the "By the Chair" column, and has been modified for this newsletter. Any opinions expressed are those of the author.
A Zones are still a problem
I run
into problems with A Zones on a daily basis, and so many of our
local officials and others working with floodplain issues in Minnesota. And we
know A Zones are a problem for much of the country, especially in the central
and western states. They often do not have have the information needed to make local zoning and development decisions, or to determine flood insurance rates.
Some
ongoing and recent examples of problems involving A Zones include:
Hearing continual complaints about
the quality of the maps, i.e., “Those FEMA maps that were drawn with
crayon.”
Convincing lenders that the map
from 1976 (or earlier) REALLY is the current effective map.
Determining Base Flood Elevations
using limited information for zoning decisions, as happens hundreds or
thousands of times a year in our state and involves significant time for
local officials and state staff assisting them.
Determining BFEs for a
dramatically higher number of pre-Flood Insurance Rate Map landowners
who have flood insurance and now need the BFE for insurance rating.
Assisting residents and local
officials with hundreds of Letters of Map Amendments a year that involve
structures well above the BFE, including a good percentage by 10 feet or
more.
On a related note, I recently read a December Marsh
report, “Reforming the National Flood Insurance Program,” that said Minnesota, as a
state, had the lowest rate of compliance for mandatory flood insurance. The
point in the report was that better compliance with the mandatory purchase
requirement is a priority, and I completely agree with that.
However, I am convinced that a big part of the
explanation for our low compliance rate has much more to do with the study
using the unmodernized floodplain digital layer that is all we have for a majority
of our counties, than it documenting non-compliance. Those older floodplain layers were a quick digitization intended for high level planning, and often did not digitize around higher islands that are up to many square miles in size. And the digital Flood Insurance Rate Maps that were started during the earlier years of FEMA's map modernizition program have A
and AE Zone layers that include areas 20-30 feet above the BFE. There’s a
reason we have so many LOMAs relative to the number of policies!
Cost efficient options available
The good
news is that current technology allows us to produce model based A Zones for a
fraction of the cost of AE Zone modeling. In ballpark figures, it costs $10,000
per mile for AE Zone level modeling versus $100 to $150 per mile for the
different levels of model based A Zones. For a large percent of the nation’s A
Zones, communities are clamoring for DFIRMs with model based A Zones. Figure 3
(below) shows the continuum of model based A Zone. Note that the A Zone in the Figure 1 and 2 examples do not have any supporting models or data, so are not even on the continuum.
Note: A recent Minnesota Water Talk
article
gives a brief explanation of the different accuracy levels for the model based
A Zones.
Unless a
detailed study is done, the BFEs and the cross sections from these model-based
A Zones will not be shown on the DFIRMs, but the models and shape files with
the BFE data are available to local officials, engineers, surveyors, etc.
Ask
any of our local officials if they’d rather have DFIRMs with these model-based
A Zones, versus wait until FEMA has the funding to do DFIRM with AE Zones, and they
will give you an immediate “YES.” These model-based A Zone help with 95 percent
of the problem situations noted earlier.
Ways to get flood zones based on
accurate data and boundaries
ASFPM’s “Flood Mapping for the Nation” report
and the Technical Mapping Advisory Council recommendations recognize there are
still large areas of the country that don’t have maps based on accurate data and
boundaries. There are many other areas that are a priority for mapping funding,
but the momentum is going in the right direction to recognize that at least a
portion of the funding needs to focus on getting at least the model-based A
Zone level of mapping nationally.
In
the counties that were mapped later in the Flood Map Modernization program, we had model-based A Zones.
In the Risk MAP program, while the focus has shifted
to watershed-based efforts and greater emphasis on outreach, FEMA is now doing
First Order Approximations, at a minimum. The good news is that the budget deal
that was just passed by Congress includes significantly more mapping funding than
we’ve seen in recent years. And we are hearing that “some” of the mapping
funding for FY16 will be targeted at getting a portion of the older, paper map counties DFIRMs based on model-based A Zones and accurate
boundaries for A and AE Zones. We need to continue to address the many
other mapping update needs, including mapping of residual risk areas, coastal flooding, erosion hazards, etc. However, I’d like to see these efforts continue until we have mapped A zones based on accurate data and boundaries nationally.
First, you break the news that since the house was built before the floodplain regulations, you do not have an elevation certificate in the city files. And the lender MUST require purchase of the flood insurance if the structure is in the flood zone, even it it is clearly well above the flood elevation.
In this example, the house is IN the high flood risk zone, so the lender must require flood insurance.The insurance agent will need the lowest floor elevation and the base flood elevation (BFE) to determine the flood insurance premium.
What is the base flood elevation?
Since
the site is currently in an A Zone, the estimated 1% annual chance
flood elevation data (i.e., the "pink lines") can be used for zoning
and flood insurance decisions. Use the estimated 1% annual chance flood
elevation as the approximate base flood elevation (BFE). In this example
the cross-section at the upstream end of the site is 765.6 (NAVD88). If
the lowest adjacent grade of an existing house is higher than the BFE,
the house is eligible to apply for a Letter of Map Amendment.
NOTE: If the site is in a current
detailed study area (Zone AE, A1-30, AO or AH), updated data on a FEMA
preliminary new map CANNOT be used for insurance rating or a LOMA until the new map is effective.
Want to learn more about A Zone models, when they can be
used, and how to see the data? See articles
on A Zone Models in the November 2015 Water
Talk.
DON"T FORGET: For zoning & permitting decisions you will use the Regulatory Flood Protection Elevations (RFPE), which is higher than the BFE. See the local ordinance for details, but the lowest floor for regulatory purposes will need to be at least a foot higher (and often more) than the BFE used for insurance decisions.
Where can the homeowner get elevation information?
(1)
Community - The first place to check is in the community records,
especially if it was built after the first FEMA map for the community
was issued. (We've already noted there is not any information for the
house in this example.)
(2)
Other public agencies - If the local watershed district (or anyone
else) requires permits or does reviews, they might possibly have elevation
information. Check with them.
(3)
Licensed surveyor - The homeowner can hire a licensed surveyor, and in some cases this is the only option. (In
unique situations - especially where there are many properties in or near a
FEMA mapped high risk floodplain, communities occasionally assist
neighborhoods with coordination of a survey, or cost-sharing for a survey.)
(4)
Option if house is clearly high - Many communities can check their
electronic mapping or a county viewer where elevation contours can be
seen. In Minnesota we have the MNTOPO
Viewer. This is a public site where 2-foot elevation contours can
be seen statewide. If the house appears to be more than 2 feet above the
BFE, see the "LOMA with 2-foot contours" option described below.
Can the homeowner get an exception for the flood insurance requirement? Yes, they can obtain a Letter of Map Amendment (LOMA)
In cases like this, where
more accurate elevation information shows the structure is above the
flood elevation, FEMA has a process to request a Letter of Map Amendment
(LOMA). The applicant submits information showing that the Lowest
Adjacent Grade (LAG) - i.e., the elevation of the lowest place the
ground touches the structure foundation (or the supports for attached
decks or stairs) - is higher than the base flood elevation (BFE). If
the LAG is higher than the BFE, FEMA will send a LOMA document
confirming that - based on the more accurate data - the structure is not
in the high flood risk area and that flood insurance is not mandatory.
The elevation information must be provided by a licensed surveyor or a
professional engineer, with two main exceptions:
LOMA-OAS
eligible - Where the structure is not actually shown in the high flood
risk zone. If the structure is near a flood zone, but an aerial photo
with the floodplain overlaid on top shows it's not in the flood zone,
the elevations are not required. FEMA will accept the application
without a survey and will issue a "Letter of Map Amendment - Out as
Shown," or LOMA-OAS).
LOMA using the 2-foot elevation contours - See more information below.
In most of Minnesota, if the structure is clearly above the base flood elevation, there is an alternative to getting a field survey. FEMA will accept a map with an aerial photo, the 2-foot elevation contours, lot lines, and a few other details in lieu of a field survey. This is an option if:
The map is prepared by the city, county, a licensed surveyor or a professional engineer.
The 2-foot elevation contour that is below the structure (and not going through the structure) is more than one foot above the base flood elevation.
The site is in a county where the 2-foot contours have been certified for this use (all counties in Minnesota except for Pine and Stearns).