Water Talk DNR newsletter - November 2015

Water Talk

November 2015

Water Talk Newsletter is issued three to four times per year.

If you have ideas or requests for the next edition of Water Talk, contact Ceil Strauss at ceil.strauss@state.mn.us 


Overview of Moorhead’s Flood Protection Efforts

Since 2010, the City of Moorhead has been aggressive in mitigating flood risks for its community.  Much of this was brought about by the fact that six of the top ten flood crests have occurred since 1997.  The 2009 flood was the largest in the city’s history, and was the catalyst behind most of their efforts. 

Prior to 2009, the city had maintained a flood response plan, and utilized a limited arsenal of flood mitigation infrastructure.  After 2009, the city aggressively pursued voluntary acquisitions of riverfront properties to construct a permanent levee and floodwall system.  The city prioritized their target areas based on risk, with a goal of acquiring as many riverfront properties as possible and replacing those homes with a levee and/or floodwall structure.  The city knew they’d have to act quickly – while owner interest was still high.  Subsequent flood events in 2010 and again in 2011 resulted in acquisitions that were a much easier sell. 

Moorhead Brookdale Area before & after
Figure 1: Moorhead Brookdale area - Before & After


The city was very fortunate to benefit from strong and timely state and local funding support.*

*Several floodplain acquisitions were eligible for federal Hazard Mitigation Grant Program funding assistance but those federal funds were not pursued because public flood risk reduction infrastructure (levees, floodwalls, pumping stations, etc.) are not allowable on property acquired with these federal funds.

Table 1 - sources of Moorhead funding

Based upon its level of risk and need, the city was awarded nearly $73 million in state Flood Hazard Mitigation Grants (requiring a $14 million match).  The city also spent approximately $18 million in addition to their match requirement. Table1 shows a breakdown of this and other sources utilized by the city.

Table 2 - breakout of local funding sources


Approximately 90 percent of the $32 million in local funding was provided through the use of a general obligation improvement bond, and another seven percent was raised through the sale of property. Debt service payments on the General Obligation Improvement Bond are collected from the sources shown in table 2.

Special assessments were levied on approximately 8,400 properties most directly benefiting from the flood mitigation improvements. 

As of today, the city’s flood risk reduction measures have resulted in the acquisition and removal of approximately 250 riverfront homes, and the construction of 11.5 miles of levees and floodwalls, 12 pumping stations, and 78 stormwater gates. 

Sample before and after in Moorhead
Figure 2: Moorhead Country Club area - Before & After

At the Minnesota Association of Floodplain Managers annual conference in Moorhead November 18-20, 2015, attendees had an opportunity to see many of Moorhead's flood reduction efforts!

Most of the content of this article was provided by the City of Moorhead, with modifications by DNR Floodplain program staff. The aerial photos were provided by the City of Moorhead.


Austin's Mitigation Projects, Including "Invisible Floodwall"

The past 15 years have been hard on the City of Austin when it comes to flooding. Five of the ten highest flood crests have hammered the city since 2000, with the highest flood on record to date hitting the city in 2004 when the Cedar River crested at 25.0 feet.[1] This particular event was a catalyst for the community to rethink its relationship with the river and identify how to best to protect the citizens and property.

Historically, the city has been very active in its acquisitions of at-risk properties in the floodplain.  By 2001, the city acquired over 160 homes using $1.7 million received from federal sources at a cost-share split of 75% federal / 25% city. These acquisitions have helped the city avoid over $3.9 million in potential losses to the acquired properties.[2] 

Following the 2004 flood, the city developed a plan to implement a comprehensive flood control project for the North Main Street area, and a local option sales tax was approved by voters in 2006 to help fund the mitigation efforts. The half-cent sales tax, dedicated to fund flood mitigation projects, expires in 2026. In addition to the half cent tax, funding was also provided by $5 million in federal grants and $3 million in state grants (through the Minnesota Department of Natural Resources Flood Damage Reduction grants).

Before these improvements were achieved, however, major flood events occurred in 2008 and again in 2010.

The city’s mitigation improvements were substantially completed in 2014, and are composed of: 1,700 linear feet of earthen levee, 740 linear feet of concrete floodwall, and seven gated structures, including a reach of invisible flood wall.[3] A portion of the flood wall that can filled in and made “visible” is shown in figure 3.

Austin floodwall medalian & close up
Figure 3: Close up of City of Austin "Invisible Floodwall" (Note the slots for placing stop logs during floods)

Austin is one of seven Minnesota communities in the Community Rating System, and is one of only three CRS, Class 5 communities in the state. This impressive CRS rating earns property owners in the city’s Special Flood Hazard Area a 25 percent discount on their flood insurance policy premiums. 

Following the 2004 flood, the city also helped found the Cedar River Watershed District to assist in addressing other watershed-wide problems. Furthermore, the city instituted a flood watch and warning system for the floodplain area. Watches and warnings are disseminated by local radio and TV, and by police vehicles equipped with high/low siren settings and public address systems.

Moving forward, the city plans to alleviate some of the flood risk to properties along Turtle and Dobbins Creeks with the preliminary goal of removing high-risk structures from the floodplain. The city also expects to benefit from a new $6.4 million CRWD project, which will implement 25 projects relating to water quality and flood control.

Austin is a good example of a Minnesota community dedicated to development/redevelopment focusing on long-term sustainability and disaster resilience.

Austin flood control project
Figure 4: City of Austin floodwall is incorporated with open space that is used when there is not flooding in progress.


 [1] “Historic Crests”, Cedar River at Austin, last modified February 12, 2015. National Weather Service, National Oceanographic and Atmospheric Administration. http://water.weather.gov/ahps2/crests.php?wfo=arx&gage=astm5&crest_type=historic.

[2] “Losses Avoided due to Home Acquisitions in Austin, Minnesota”, March 2001. FEMA. http://www.fema.gov.

[3] “Austin Flood Control”, 2015. Reiner Contracting. http://reinercontracting.com/project/austin-flood-control-project/.

Article provided by FEMA Region 5, with modifications by City of Austin and DNR floodplain program staff. Photos provided by City of Austin.


Zoning Challenge - Can I Use the New Maps that are not Effective Yet?

You are the local floodplain manager, and your community has a Letter of Map Revision for a large flood reduction project that has been issued, but will not be effective for several more months.  This LOMR replaces a current detailed study (Zone AE).

A resident is requesting a permit for a building at the minimum elevation that the city's ordinance will require once the LOMR is effective, but that would be too low based on the current effective map.

The applicant has been advised that the pending new map could be appealed, and it is possible the final base flood elevation could change. Can you issue the permit?

LOMR effective in future


See bottom of this Water Talk newsletter for answer.


Risk MAP Fall 2015 Update - Minnesota

FEMA’s national Risk Mapping, Assessment, and Planning (Risk MAP) program is intended to result in local policies and actions that reduce risk. In 2014, in partnership with the State of Minnesota, FEMA Region V initiated activities designed to engage selected communities in discussions about local risk reduction actions that result in safer communities. Since then, FEMA Region V and the state has been facilitating meetings with community officials, mitigation consultants, and regional stakeholders to define desired local mitigation action implementation steps, challenges, and needed technical support. This effort is not intended to replace existing mitigation planning efforts, but to enhance them by identifying federal and state tools, resources, and technical assistance that may enable progress on local risk reducing mitigation actions. The meeting goals include development of a local implementation strategy for a community-selected mitigation action, and in some cases, limited technical support toward progress on that action.

Over the past few months, FEMA and the Minnesota Department of Natural Resources and Department of Public Safety (Homeland Security Emergency Management - HSEM - Division) have been working with STARR, FEMA’s consultant, to provide technical assistance to selected Minnesota communities with a strong interest in reducing local risk from natural hazards. Communities have received several types of assistance, such as flood depth grids to inform recreational area designs and prioritize future flood risk reduction projects, support with improving ordinances to include higher standards based on better flood risk data, and assessment support for mitigation grant applications. In the St. Louis River Watershed, mitigation technical assistance needs have been documented for future funding considerations and to inform local planning efforts. 

Over the winter, the program will be wrapping up efforts to support communities with local mitigation needs. Going forward, FEMA and the state will be considering additional technical assistance support and other efforts to help communities take action to reduce flood risk.

If you have any questions about the program, please contact any of the following project partners:

Suzanne Jiwani, MN DNR, at suzanne.jiwani@state.mn.us

Jennifer Nelson, MN DPS, at jennifer.e.nelson@state.mn.us

Tom Smith, FEMA RV, at thomas.smith6@fema.dhs.gov

Jon Johnson, STARR, at jonathan.johnson@atkinsglobal.com

Article provided by FEMA Region 5


A Zone Models: When Can They be Used for Best Available Data BFEs?

A Zone model levels
Figure 5: A Zone study level of detail continuum

Types of A Zone Models

Traditionally, A Zones, also known as “approximate” study zones, have had little to no data supporting the mapped flood zones. However, with current technology and the availability of LiDAR data, the quality of data supporting A Zones (and their delineations) has radically changed in recent years.

Most A Zone models provide “estimated one percent water elevations” that can be used as “best available data” that are especially helpful when it’s not a close call. Following is a summary of the different levels of data supporting A Zones.

  • Old A Zones - Little or no survey work done, and minimal if any supporting data
  • First Order Approximations (FOA) - A new level of modeling that FEMA starting doing recently. The FOA models are VERY quick, and typically not accurate enough to be used as best available data. They are done to do a quick check of the accuracy of old A Zone floodplain layers to verify if mapping updates are needed.
  • A Zones Studies - The newer A Zone models use a computer model (i.e., HEC-RAS - a hydraulic backwater model) to determine flood elevations and delineations. Simpler methods (i.e., USGS regression equations in Stream Stats) for the hydrology (the amount of water) and cross sections are developed based on the LiDAR elevation data. At most road crossings it is assumed the bridge or culvert is blocked (and the floodwaters are flowing over the roads).
  • A Zone Studies (hybrid) - In some cases, especially in Minnesota, the A Zone studies were improved by including the road crossing culvert or bridge information if the difference between the upstream and downstream one percent water surface elevations was significant (> 2-3 feet).
  • Limited Detail Studies - Limited Detail A Zone models normally use the LiDAR data for cross sections, but use field surveys for the culvert and bridge crossings (and some channel bathymetry). So the limited detail studies are closer to the quality of detailed studies, but don't have quite with the level of rigor and review required to show the elevations on the FEMA maps. Past evaluations have shown that these limited detail studies are accurate to +/- one half foot.
  • Detailed Studies -  Detailed studies are based on field surveyed cross sections & road crossings, and a higher degree of rigor in the modeling and review is required by FEMA. Detailed study BFE elevations are shown on the FEMA maps. Detailed studies are expensive.

When and How Can A Zone Model BFEs Be Used?

The "estimated one percent water surface elevations" from A Zone models can often be used as "best available data" for a Base Flood Elevation. Following are some guidelines for when the data from A Zone models can be used as best available data for BFEs:

  • When the A Zone study (or Limited Detail study) is the supporting data for an updated FEMA countywide map or watershed study, and
  • There is not a more detailed study for the area in question.
  • IF the data are being used for a single lot, the estimated A Zone (or Limited Detail study) data can be used for zoning decisions and to apply for Letters of Map Amendments and Letters of Map Amendments based on Fill.

Caveats/Reminders:

  • A Zone data cannot be used for larger developments (i.e., detailed methods must be used for developments greater than 50 lots or five acres, whichever is lesser).
  • First Order Approximation data are typically not acceptable without refinement.
  • A Zone models can be modified to make them more detailed, i.e., add culvert/bridge data.

A Zone Models: How Do I Get the Data?

Where are model supported BFEs (i.e., "pink lines") available in Minnesota?

In Minnesota, the A Zone modeling that can be used as best available data for BFEs is being put into a digital layer titled "Estimated 1% Water Surface Elevation." In the default file format, they are shown as bright pink lines, so MnDNR floodplain staff refer to this layer as the "pink lines."

In general, A Zone modeling is available, or is in the process of being finalized for:

(1) Counties with countywide map updates that were funded starting in about 2007

(2) Watershed level (HUC8) efforts (mainly funded by FEMA under the Risk Map program).


A zones statewide

Where Can I Obtain Zone A Model Digital Data?

GeoCommons clip

Spatial data available in Minnesota can be downloaded at the Minnesota GeoCommons site.

The FEMA floodplain layer is updated as new FEMA countywide maps and Letters of Map Change become effective and as new A Zone modeling completes the quality control review process.


See a sample of the default format for the FEMA floodplain layer, including the estimated one percent water surface elevations in Figure 6.

Example of pink lines
Figure 6: Example of FEMA floodplain data


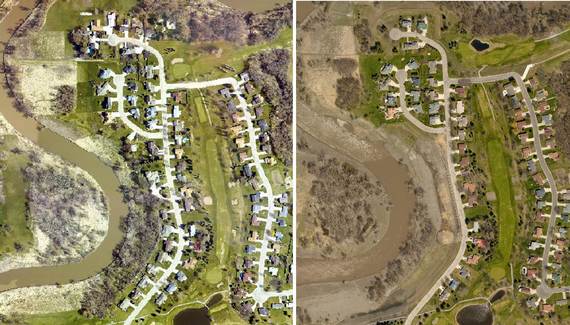
The FEMA floodplain layer can be used with other layers a community has already obtained. Below is an example overlaying A Zone model data in the FEMA floodplain layer on an aerial photo.

pink line overlay example
Figure 7: Example of using the A Zone model data (aka "pink lines") at the site level.

The Estimated 1% Water Surface Elevation (to the nearest tenth of a foot*) can be seen when zoomed in.  These elevations can be used as best available data for the base flood elevation (BFE) if the conditions noted above are met.

* NOTE: Some of the A Zone model layers available through the Minnesota GeoCommons site show the estimated water surface elevations to more significant figures than tenths, but they are NOT really that precise! Due to the different model formats and sources, it would be too time consuming to fix the elevation format for some A Zone model layers while making them available in a timely manner.


FEMA Map Updates - Scheduled/Anticipated Dates

(And updates since last Water Talk)

 New Maps Effective:

  • Pigs Eye Levee panel; Ramsey County – September 16, 2015
  • Kandiyohi County – September 30, 2015
  • Norman County – September 30, 2015

Letters of Final Determination (Letters sent 6 months before effective dates):

  • Anoka County – June 16, 2015 (effective 12/16/2015)
  • Hastings Levee panel; Dakota County – September 16, 2015 (effective 3/16/2016)
  • Hennepin County – February 2016 (anticipated)
  • Scott County – March 2016 (anticipated)
  • Blue Earth County – Uncertain (on hold - levee issues)
  • Kittson County – Uncertain (On hold - levee & ring dike issues)

 90-Day Appeal Periods:

  • Marshall County – October 1 to December 29, 2015
  • Crow Wing County – November 5, 2015 to February 2, 2016
  • Olmsted County (2nd) – February to May 2016 (anticipated)
  • Roseau County (2nd) – February to May 2016 (anticipated)
  • Carver County – February to May 2016 (anticipated)
  • Wright County – February to May 2016 (anticipated)
  • Nicollet County – Uncertain (on hold - levee seclusion question)

 Open Houses/Resilience Meetings:

  • Crow Wing County – July 14, 2015

 New Preliminary Maps:

  • Carver County (revised) – September 14, 2015
  • Olmsted County (revised) – September 14, 2015
  • Houston County (revised) – November 2015 (anticipated)
  • Yellow Medicine County (revised) – February 2016 (anticipated)
  • Fillmore County (revised) – February 2016 (anticipated)
  • Winona County – March 2016 (anticipated)
  • Chippewa County – Uncertain (on hold - levee seclusion question)

 NOTE: Anticipated dates likely to be pushed back as issues arise


Zoning Challenge Answer

No, in this scenario a permit cannot be issued based on the new Letter of Map Revision (LOMR) until the effective date or later.

When the current effective map is an AE Zone (i.e., or some other type of detailed study), the pending updated map cannot be used for zoning decisions or Letters of Map Changes - such as Letters of Map Amendments (LOMAs) or Letters of Map Revisions based on Fill (LOMR-Fs).

A permit could be issued to do some of the site preparation - such as grading or at grade slabs or similar features - that would be consistent with the current effective ordinance. But permits for buildings and structures that are not elevated or floodproofed based on the elevations of the current effective map are not allowed.

Related Scenarios:

  • IF current map is AE Zone, and new countywide map is going to be effective in a few months: This is the same situation as our zoning challenge. The current AE Zone map data must be used until the new map is effective.
  • IF the flood elevations will be going UP on the maps that will be effective in the future:  The community could adopt the future map and the current map, and require meeting minimum elevations based on the higher of the two elevations. Even if the future map is not formally adopted, the community should advise applicants of the coming changes, and should encourage going to the higher elevation so the building is not immediately a non-conformity and so the flood insurance premiums are not prohibitively high.
  • IF current Map is A Zone: If the current map is A Zone (approximate study), the data in the LOMR that has been issued but is not effective can be used as "best available data" for the site. 

Note: See FEMA floodplain Management Bulletin 1-98, Use of Flood Insurance Study (FIS) Data as Available Data