|
Upcoming 2023 VLDS Research Forum - Don't Forget to Register!
The 2023 VLDS Research Forum which will be held IN PERSON on September 27th and 28th in Richmond, Virginia. This event will bring researchers, legislators, and agency leaders together to explore how strategic data analytics can drive important research to inform powerful decision making at every level. The event will provide both an overview of the VLDS and an opportunity to learn more about how it is being used across the state of Virginia.
To register for the forum, click here. For more information about the event visit the new event website!
New VLDS Website
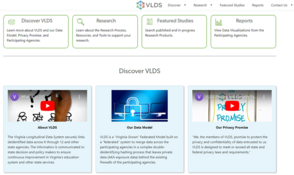
We are excited to introduce our newly modernized VLDS website! Discover a seamless user experience, sleek design, and enhanced features that make navigating through our content effortless. We invite you to explore our newly structured information and stay up to date with the latest news. Welcome to our new online presence!
|
New Data Visualizations
Exploring Key Virginia Educational Issues through Interactive Data Dashboards
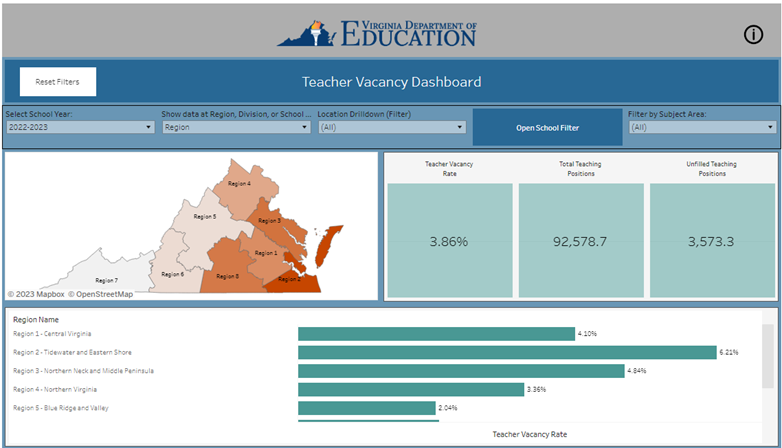 Virginia Department of Education launched a new Interactive Data Dashboards webpage in its Data & Reports section. This page presents a collection of interactive and intuitive visual representations that aim to inform educators and the general public about important educational data. This growing library of visualizations provides a comprehensive overview of various educational metrics, allowing users to explore and gain valuable insights.
|
|
System Tip of the Quarter
While using VLDS, keep in mind that years are represented differently by different agencies. For example, the school year starting in the Fall of 2022 would be represented as 2223 in SCHEV but 2022 in DOE. Also some agencies, like SCHEV and DOE use school years while other agencies may use calendar years to better represent the data they are sharing. Make sure to check the VLDS Lexicon or ask your agency sponsor to avoid confusion!
Fun Fact of the Quarter
Did you know that the human brain can process visual information much faster than text? In fact, a study at MIT found that people can process images in as little as 13 milliseconds! Additionally, research has demonstrated that using a combination of visuals and text improves material comprehension for learners of all ages. For these reasons, data visualization is an effective way to communicate complex information quickly. There are many different types of data visualization choose from. Each type has its own strengths and weaknesses and is best suited for certain types of data. The Visual Vocabulary on Tableau is a helpful tool to select the chart that might work best for your data.
|
|
|
Advanced Placement Disparities for Economically Disadvantaged Students
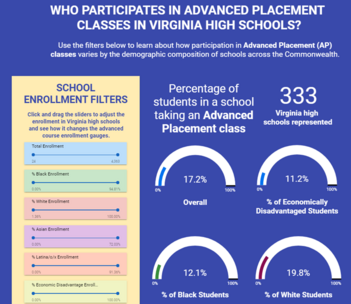
Do you know that only one in 10 economically disadvantaged students in Virginia high schools participated in Advanced Placement classes in the 2020-2021 school year, and only one in 20 participated in high poverty schools? The Metropolitan Educational Research Consortium (MERC) analyzed VLDS data over five years for their Equitable Access and Support for Advanced Coursework Study to explore the landscape of advanced course taking in the MERC region. In addition to a static report that will be published this fall, MERC also built a dashboard depicting advanced coursework participation data in the metropolitan Richmond region five years prior to COVID-19, and a companion dashboard using 2020-2021 VDOE data depicting AP and Dual Enrollment in all Virginia high schools in the 2020-2021 school year. Through these resources, users can interact with aggregated data depicting how participation in elementary gifted programs, middle school Algebra I, and high school AP and Dual Enrollment courses varies by the demographics of students as well as the racial and socioeconomic composition of the schools they attend.
|
|
|
Past Events
2023 NCES STATS-DC Data Conference
The 2023 NCES STATS-DC Data Conference was held in person from August 9-11, 2023 at the Hyatt Regency Bethesda in Bethesda, MD. The theme of this year’s conference was Managing the Data Highway. Several VLDS research analysts were able to attend this year to learn valuable information about data management and analytics. Learn more about the sessions and information shared on the event website!
|
|
|
|