 Welcome to the second issue of our budget special edition newsletter. I was happy to hear that so many of you found the first installment helpful, and I hope this issue will be equally useful. Sharpen your pencils!

They say a picture is worth a thousand words. Sometimes its value can be measured in cold hard cash, as was the case with a photo sent to me by one Minneapolis family on Saturday showing me that their property tax bill had shot up more than $1,400, with the city portion accounting for more than half of the increase. These aren’t millionaires in a mansion. This is a solidly middle-class couple living on a fixed income. They’ve lived in their home for 35 years. Minneapolis is where they raised their kids. It’s where they help take care of their grandchildren. The picture came with a simple question: why are my taxes going up by so much?
This week is about you, the taxpayer: what you pay, why your bill keeps rising, and what's coming next.
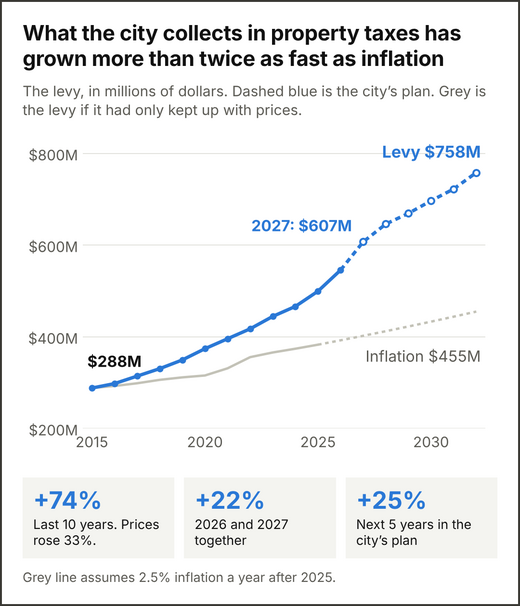 Last week we covered the basics.The total the city collects in property taxes each year is called the levy, and it's the number to watch.
The levy is up 74% since 2015, more than twice the 33% rise in general inflation. The Mayor has proposed another 11.3% increase for 2027. I believe it is fair to ask why increases keep coming at such a high rate, and whether the money is making the city better in the ways residents need.
Your bill comes together in four steps:
-
The Board of Estimate and Taxation sets the maximum levy in September. From there, the levy can go down but not up.
-
The Council then sets the final levy within that limit - this the amount of dollars the city needs to cover its costs after state aid and fees (decided in December as part of the budget process).
-
The Assessor then values every property in January.
-
State law sets tax rates by type of property: businesses are taxed at roughly twice the rate of homes, so a $300,000 shop or office pays nearly twice the city tax of a $300,000 home.
-
The county divides the levy by the total tax base to get the rate and mails your bill.
The key point: the levy is set first, and the rate follows. If the city needs more dollars, taxes rise. And if part of the tax base shrinks, the same dollars are spread over everyone else, even if the city asks for nothing more.
Three quick examples to bring this to life.
Three quick examples to bring this to life. We’ll come back to them later, because they matter for the rest of the story. Picture a made-up city that needs to raise $100. It has $6,000 worth of homes and $2,000 worth of offices. Because offices are taxed at twice the rate of homes, homes pay $60 and offices pay $40. Now watch what happens to homeowners when we change one thing at a time.
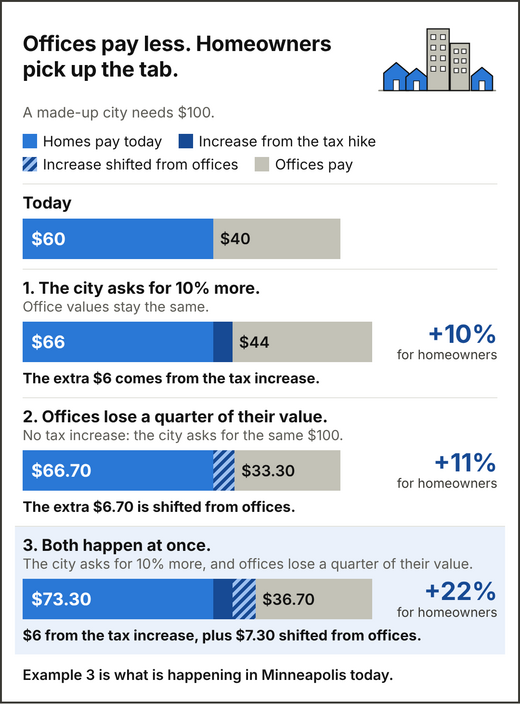 In Example 1, the city raises taxes, and everyone pays 10% more, homes and offices alike. In Example 2, the city doesn’t raise taxes at all, yet homeowners still pay 11% more. That increase is shifted from offices: when their values drop, they pay less, and the same $100 gets spread over everyone else. In Example 3, both happen at once. Homeowners pay 22% more, more than double the 10% the city asked for, because the shift from offices stacks on top of the tax increase. That’s Minneapolis today.
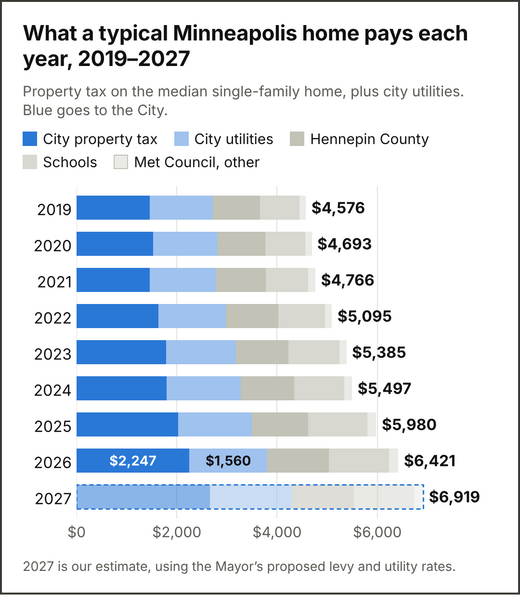
- A typical homeowner pays about $6,421 this year in property tax and city utilities, up 40% from $4,576 in 2019, while general inflation was 23%.
- The City takes the biggest share, $3,807 or 59%: $2,247 in property tax and $1,560 for water, sewer, stormwater and trash.
- Hennepin County, the schools and regional districts make up the rest.
The city's property tax, $2,247 or 35% of the total bill, is the largest piece and the fastest growing, up 54% since 2019. It is also the piece the Council sets each December, so it is the focus of the rest of this issue.
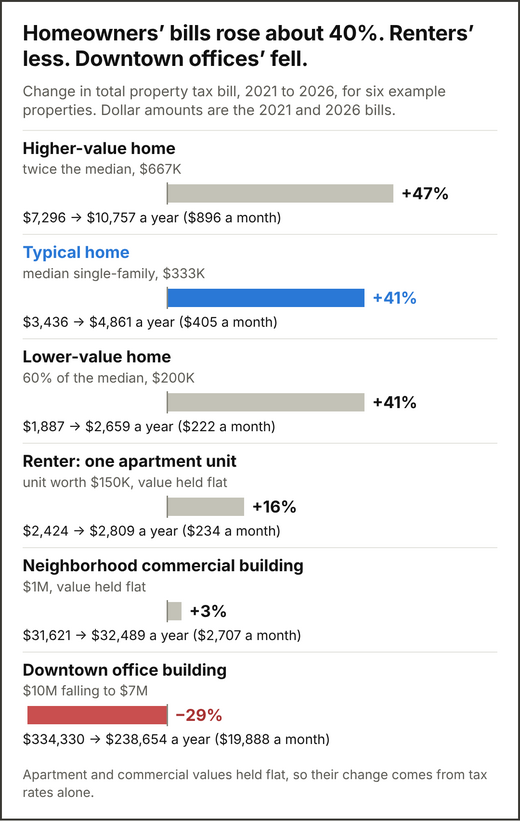 Homeowners at every price point saw their property tax rise about 40% from 2021 to 2026. A downtown office's bill fell about 30%. Renters pay through rent: a typical apartment unit carries about $234 a month of property tax, and that unit's tax bill rose 16%. Renters' story is more complicated. Softer apartment values have kept their tax increase smaller so far, but the pressure on rentals is building in other ways. We'll unpack it in a future issue.
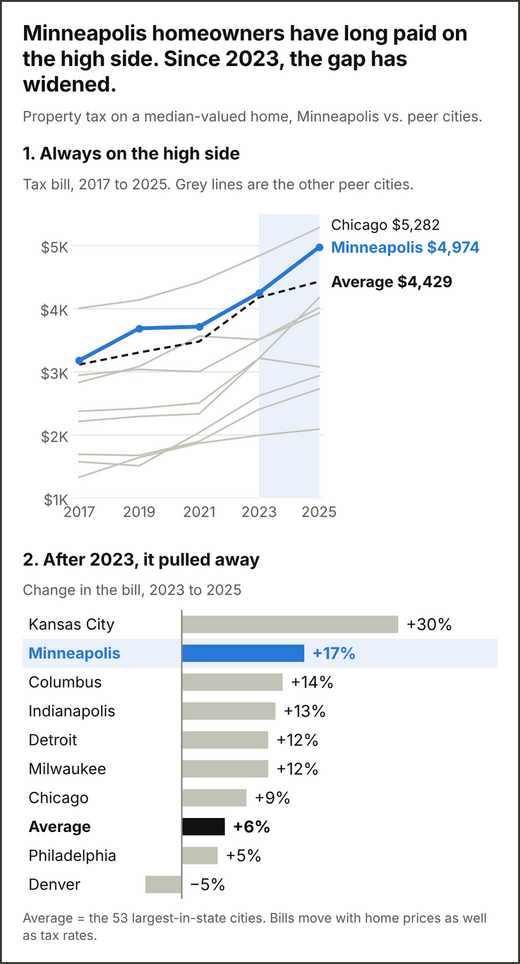
Before digging into our recent increases, it's worth seeing how we compare with similar cities. To no one's surprise: Minneapolis homeowners have long paid more than most (among eight peer cities only Chicago's is higher). However, until 2023 the gap between Minneapolis and the big-city average was modest. Since then it has widened - from 2023 to 2025 our bill rose 17%, nearly 3x the average increase.
 What's driving high, rising property taxes?
The easy answer is that the city is spending more, so property taxes go up to keep pace. That is partly true.
But spending alone doesn't explain the bill. Two other forces matter just as much, and aren't spoken about enough:
1. Every other source of revenue is flat, so the property tax carries more.
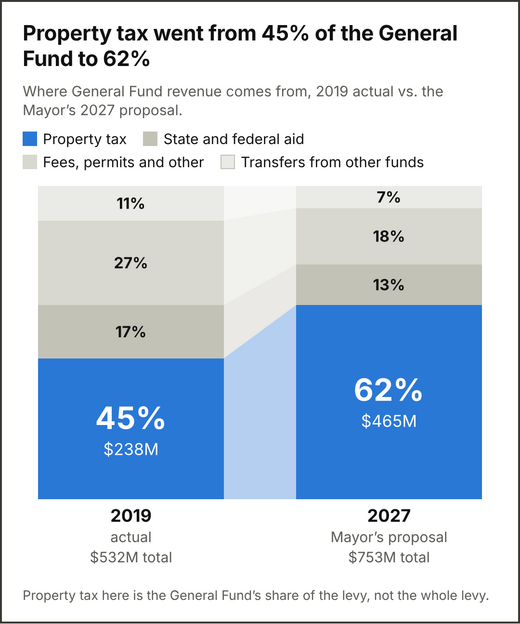 Everything else the General Fund collects, from state aid to permits, fees and interest, comes to about $288 million in 2027, slightly less than it did in 2019. State aid has not increased at all. So as the city's spending has grown by $221 million since 2019, property taxes have covered every dollar of it.
An analogy: the roommates
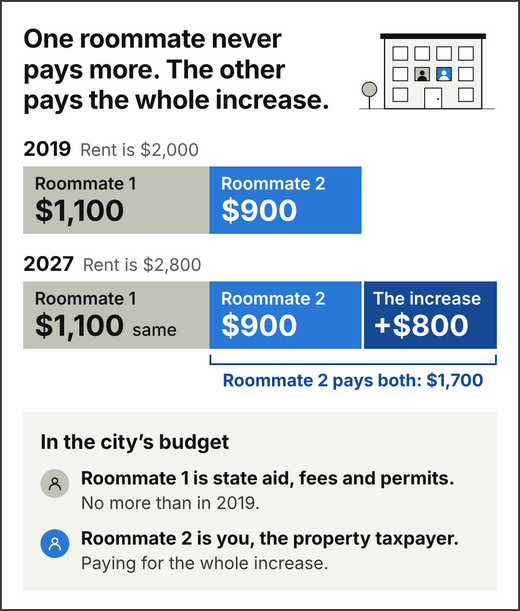
Two roommates split a $2,000 apartment in 2019. One pays $1,100, the other $900. By 2027 the rent is up to $2,800. The first roommate never paid a cent more and still pays $1,100, so the other is stuck with the rest: $1,700, nearly double. In Minneapolis's budget, the first roommate is state aid, fees and permits. You're the other one, left with paying for all the cost increases.
 2. Within the property tax, the load has shifted onto homes.
Your bill depends on what your property is worth relative to everything else in the city. Office values have fallen in downtowns across the country – our downtown commercial values are down by about a third. The effect is magnified by how Minnesota taxes property: commercial properties pay approximately twice the rate of residential properties, meaning that drops in commercial property values hit homeowners particularly hard. Put differently, every $1 of office value that disappears takes as much out of the tax base as $2 of home value.
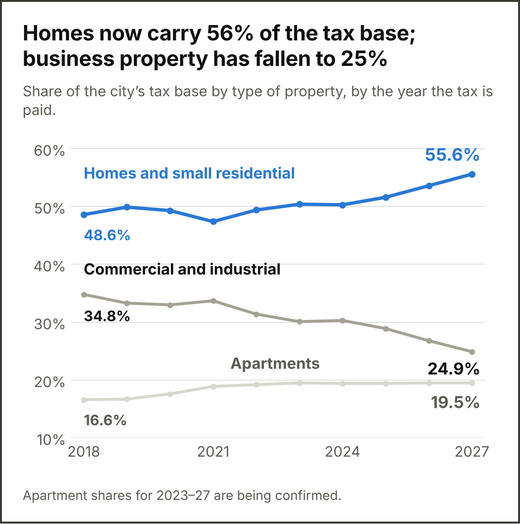 The chart above shows this: since 2021, homes' share of the tax base has risen from 47% to 56%, while business property's has fallen from 34% to 25%.
One important note: a downtown recovery would not fix the budget. If office values come back, homeowners' bills would rise more slowly, but the city would not collect a dollar more. It would change who pays, not how fast costs grow.
The chart below brings this all together. For a typical resident - since 2021, only about half of the increase comes from rising city costs. The other half comes from the two forces that get less focus: revenue besides the property tax hasn't kept up, and homeowners are carrying a bigger share of the tax base.
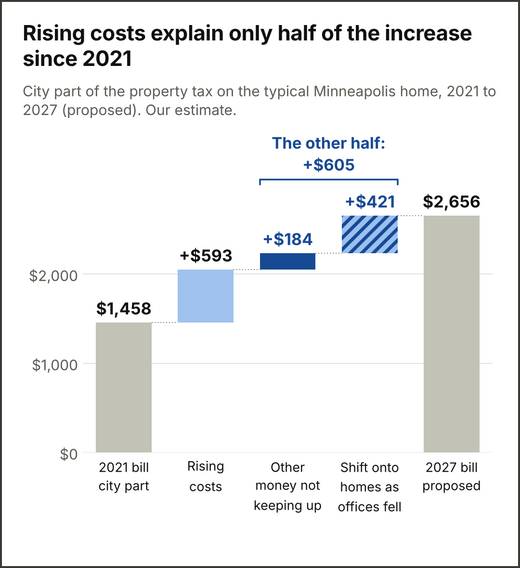
The Mayor's 2027 proposal raises the levy 11.3%, to $607 million, the largest one-year increase in at least 20 years. For the typical homeowner, that is about $409 more on the city part of the bill.
I believe we have to fight for the 2027 increase to come in below 11%. It won't be easy, but I think there is a path to something closer to 6% if we take a hard look at costs. We'll lay out that path in a future edition.
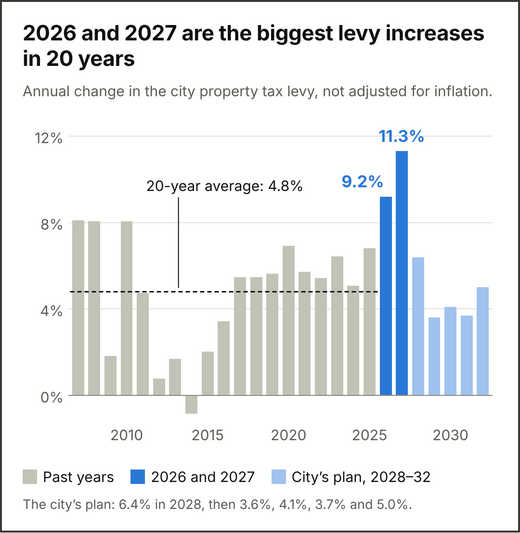 I am also increasingly concerned about the optimism built into future increases. The city's plan has the levy rising 6.4% in 2028, then just 3.6%, 4.1%, 3.7% and 5.0% over the following four years.
Those increases are a good goal: they would bring us back below our 20-year average. But writing these numbers down doesn't make them true. We have to make them true, with planning and decisions that start now. I worry that if we continue on our current path, the real increases will be much higher. Holding these future increases down will mean getting our arms around this from every side:
- Manage costs and making tough choices - sooner rather than later.
-
Stop making property owners the only ones who cover the growing bill. The state's own formula says we should get $139 million in aid; we get $82 million. Closing that gap is essential.
-
Restrengthening downtown and commercial property. A healthy commercial base carries its share of the levy, so homeowners and renters don't carry it for them. A strong downtown is also key to the health of our region.
Key takeaways from this week
-
The city sets the levy first; your bill is your share of it. The Council picks the dollar total; property values decide who pays it. If others' values fall, your share rises.
-
Property owners pay most of the bill, and more every year. Property tax goes from 45% of the General Fund in 2019 to 62% in 2027, because other revenue has stayed flat.
-
The load has shifted from downtown onto homes and renters. Homes' share of the tax base has gone from 47% to 56% since 2021.
-
2027 would be the biggest increase in 20 years. The Mayor proposes 11.3%. I believe we have to push it lower, and start the hard work of reversing this trend now.
Where we'll go next
Next week: where the money goes. What has driven the city's costs since 2019, from wages and health care to public safety and new programs.
Questions? Write to me at ward7@minneapolismn.gov.
Sources and notes for the charts
- Levy (incl. Park Board): ACFR Schedule 8, 2015–2025; 2026 Adopted Budget; 2027–32 Mayor's Recommended Budget p.90. Prices: BLS CPI-U, Minneapolis–St. Paul. 2.5% inflation after 2025 is our assumption.
- Hennepin County rate breakdowns, payable 2021–2026 (2019–20 rates estimated from ACFR Schedule 6); median values from the City Assessor; utilities = 'average residential customer' bill in each adopted budget. Before state refunds; city tax includes Park Board.
- Our model: Hennepin County tax rates, payable 2021 and 2026, and Minnesota class rates. Before state refunds.
- 50-State Property Tax Comparison Study (Lincoln Institute / Minnesota Center for Fiscal Excellence), 2017–2025 editions. Latest year is 2025.
- 2019 CAFR MD&A p.14; 2027–28 Recommended Budget Schedule 2, p.661.
- City Assessor reports 2024–2026, net tax capacity by class. 2027 based on the 2026 assessment.
- Our estimate from Hennepin County rates (2021, 2026), the 2027 proposed levy, and General Fund revenue (2021 ACFR; Recommended Budget p.661). 'Other money' = levy growth needed because other revenue grew slower than the fund; 'shift' = change in the typical home's share of the tax base.
- ACFR Schedule 8 (2006–2025); 2026 Adopted Budget; 2027–28 Recommended Budget p.90. Includes Park Board.
|