|
View as a webpage / Share
|
 
|
Maine Geological Survey
|
Maine Beach Mapping Data Released
This week, the Maine Geological Survey (MGS) updated its Maine Beach Mapping Program (MBMAP) viewer with data collected during the summer of 2022.
MBMAP is a program that MGS instituted starting in 2005 at some beaches (2007 at most beaches in southern Maine) to monitor how Maine’s dunes change over time. The program collects the locations of specific shoreline features using a very precise global positioning system. In 2017, we added mapping of the mean high water contour so that we could quantify how the beach changed as well. This also allowed us to monitor how the dry beach width (the width of beach between the mean high water contour and the dune or seawall) is changing.
|
Users can visualize the following:
-
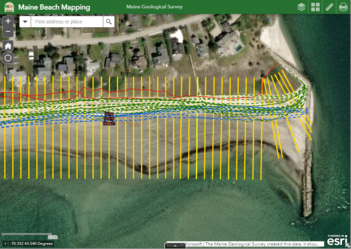
Shoreline positions symbolized by red lines for natural shoreline features, black lines for seawalls, and blue lines for high water lines. These include shoreline positions collected as part of MBMAP since 2005, but also historical shorelines digitized from historical aerial images going back to the 1960s, 1970s, 1980s, and 1990s, as available (though these are not included in MBMAP shoreline change calculations). Simply click on a shoreline to view information on the shoreline type and date collected.
-
Dune changes (in feet per year) symbolized by shore-perpendicular color-coded transects ranging from yellows, oranges and reds (signifying dune loss) to light and dark greens (signifying dune gains). Click on a transect to view information on the supporting data, including the analysis date range and the dune change rate, derived from a linear regression rate (in feet per year) of the data, along with a range of supporting statistical information.
-
Beach changes (in feet per year) symbolized by shore-perpendicular color coded transects that follow symbology of dune changes, described above.
-
Mean dry beach width (in feet), which is the average dry beach (distance from mean high water line to dune or seawall) over the time period of data collection. This is symbolized by colors ranging from red (narrow) to green (wide). Note that in 2022, the average dry beach width for all monitored beaches was 86.9 feet, with beaches with seawalls averaging 62.4 feet, and those with natural dunes averaging 92.3 feet.
-
Dry beach width change from previous year (in feet), which is the change in the dry beach width from 2021 to 2022 at a given transect. This is symbolized as beach width losses (yellows to reds) or width gains (light greens to dark greens).
To help in using the viewer, there is a short video tutorial at the bottom of the page in addition to a frequently asked questions section. Data is also available for download for use in geographic information system applications. Please share with appropriate coastal stakeholders in your town or region.
|
|
|
Maine State Government is an equal opportunity provider and employer.
   
Manage Preferences | Unsubscribe | Help | Credits | Contact Us
|
|