|
|
Environmental Public Health Tracking Newsletter
|

New Features Added to Data Portal!
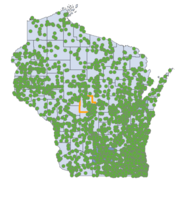
We are excited to announce that we have added two new features to our data portal: the Overlay and Points of Interest tabs. You can now choose to layer point-level data over a primary dataset base map. After choosing a primary dataset, you can click the “Overlay” tab to display point-level data on motor vehicle fatalities or water contaminants in public water systems. You can also click the “Points of Interest” tab to overlay the locations of several types of agencies, including Tribal clinics, local health departments, nursing homes, hospitals, and federally qualified health centers.
These options allow more flexibility to compare data topics; however, please note that correlation between datasets does not imply causation. We plan to expand the Overlay option to include more data topics in the future.
There are also two new datasets available at the Census Tract level under the Populations and Vulnerabilities Category: In the Life Expectancy topic, you can view Average remaining lifetime at any given age group for the period 2010–2015 and Life expectancy for the period 2010–2015.
Please let us know what you think of these new features and if you have any feedback!
Image includes example map with locations of motor vehicle fatalities overlaid.
|

Updated Data Available!
We recently added a new data topic to our data portal and updated data for existing topics. Data are available at the county level, and some measures include data at the census tract level.
New Data Topic:
Tobacco: cigarette smoking prevalence, including current smokers, former smokers, and never smokers
Updated Data Topics:
-
Adult lead poisoning: updated with 2020 data
-
Alcohol: outlet density, hospitalizations, deaths (all updated through 2020)
-
Asthma: ED visits and hospitalizations (both updated through 2020)
-
Cancer: all topics updated through 2018
-
Childhood lead poisoning: all topics updated through 2020
-
Immunizations: all topics updated with 2020 data
-
Lyme disease: updated with 2020 data
-
Oral health: ED visits (updated through 2020), licensure (updated through 2019), Medicaid (updated through 2020)
-
Toxic air emissions – all topics updated through 2019
|

New CDC Environmental Justice Dashboard
CDC Tracking has released a new Environmental Justice Dashboard! This new Dashboard includes data on environmental exposures, community characteristics, and health burden—factors important for understanding and addressing environmental justice issues.
Data on the Environmental Justice Dashboard can be used to:
- Identify communities disproportionately impacted by environmental exposures, such as air pollution and the effects of climate change.
- Understand characteristics of a community, such as demographics, access to resources, and the built environment.
- Understand the health burden in a community.
- Identify and address environmental and health inequities.
- Allocate resources and inform policy decisions to achieve environmental justice.
Get started exploring environmental justice data for your community!
|
New Lead Poisoning Resources
We have a few new resources to highlight important information on lead poisoning, including a surveillance brief on Adult Lead Poisoning in Wisconsin and a new video Data Byte on Childhood Lead Poisoning.
Video Data Byte: Childhood Lead Poisoning
This short video includes Wisconsin-specific data, information on how exposure to lead can make children sick, and steps to keep your family safe. This video is great to include on your website or on social media!
|
|
 |
 |
|
Surveillance Brief: Adult Lead Poisoning in Wisconsin
This surveillance brief includes information on adult lead poisoning in Wisconsin, including background information, Wisconsin-specific data (incidence and prevalence), and prevention measures.
|
|
|
Please do not reply to this email message. If
you have a question, please email the Department of Health Services Environmental Health. Additional information about Environmental Public Health Tracking is available
on the Department of Health Service website.
|
|
|