Climate Change Projections and Clean Energy
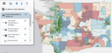
WTN launched its first climate projection data in the form of an overlay map on the Environmental Health Disparities map on the Information by Location (IBL) tool. These data show the anticipated changes in, and severity of, temperature and precipitation.
For each census tract in Washington, you can see the mean expected change in four measures between 2036-2065, and how that census tract ranks in comparison to the rest of the state.
More detailed information about each individual measure can be found on the WTN query portal. These data were created to support DOH’s designation of “highly impacted communities” under the Clean Energy Transformation Act (CETA).
Learn more about DOH's CETA work »
Improved Vaccine Distribution Equity with WTN Tool
WTN staff created a new Social Vulnerability to COVID-19 topic on the Information by Location (IBL) tool. This topic includes the 15 measures from the CDC’s Social Vulnerability Index and adds percentage population without health insurance.
Each census tract in the state is ranked by overall vulnerability and by each measure, so that vaccine distribution plans can be tailored appropriately to the areas in greatest need. For example, an area with high vulnerability due to lack of transportation might benefit from mobile or pop-up clinics, where an area with high vulnerability due to limited English proficiency would benefit from increased translation services and publicity in non-English media.
WTN hosted webinars for local health jurisdictions and providers around the state.
Watch the webinar »
|
Updated Data
All demographics are updated for 2019
Birth measures by census tract are updated for 2019
All mortality measures are now suppressed for counts greater than 0 but less than 10 due to new legislation
Explore our data »
|