|
Upcoming Modernized VLDS Research Portal!
We're excited to announce that we have been working on the modernization of the existing Virginia Longitudinal Data System Research Portal (myVLDS) and expect to launch the new platform this summer! This new tool will make it easier than ever for approved researchers and other end users to log in, submit research proposals/plans, query data, and retrieve data packages. No matter if it is about submitting a research proposal or diving into the data, this new intuitive portal will save time and help track your workflow. Whether you're a seasoned user of VLDS data or just starting out, you will find our updated platform user-friendly and visually appealing. Please stay tuned for more updates and prepare to explore the new portal soon!
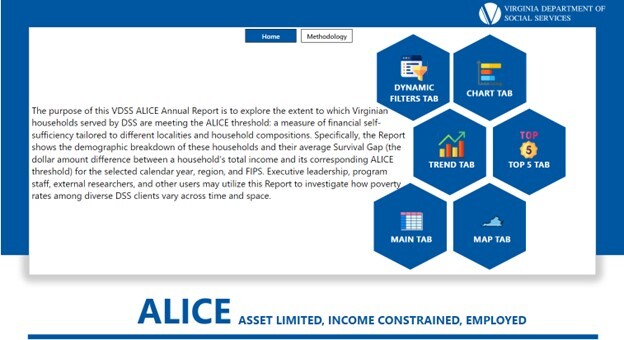
VDSS ALICE Annual Report
The Virginia Department of Social Services (VDSS) has launched a new dashboard, the VDSS ALICE Annual Report. Users can examine the level of self-sufficiency among the households served by DSS during a calendar year, as measured by the ALICE Survival Budget. The report can be found on the “Report & Studies” page of VDSS’ public website.
|
|
System Tip of the Quarter
Different tables in VLDS span different years. For example, the Department of Education Phonological Awareness Literacy Screening (PALS) data goes back to 2004, but CTE Data only goes back to 2008. Check the Lexicon and/or your agency sponsor. If the Lexicon doesn’t show recent years as being available in the table you might want to ask your agency sponsor since sometimes the Lexicon may not be up to date.
If you would like to know more about the best practices in querying the VLDS data, this webinar "How to Design, Build, Manipulate, and Analyze Effective VLDS Data Packages: Avoiding Common Errors and Pitfalls" provides a good start. This webinar was part of the 2022 VLDS Research Forum.
Fun Facts of the Quarter
Florence Nightingale, famous for her nursing work, was also a pioneer in data visualization. She used coxcomb charts (a type of pie chart) to persuade the British government to improve sanitary conditions in military hospitals in the mid-1850s. Click on this Florence Nightingale Museum link to see the chart. This statistics work helped address preventable infections and improve health outcomes.
To further illustrate the power of data analytics and visualizations, similarly also in the 1850s, John Snow used a map to plot cholera cases in London, which allowed him to see a clear pattern and uncover a contaminated water pump as the outbreak's source. This was one of the earliest example of spatial data visualization saving lives. John Snow is also viewed as a pioneer in disease mapping for the study of epidemiology. Click on the National Geographic link to see the actual map.
|
|
|
University of Virginia's Longitudinal Examination of Virginia's Public Education System Spanning the COVID-19 Pandemic
The Institute of Education Sciences (IES) announces a call for application for the grant of "Using Longitudinal Data to Support State Education Policymaking" almost every summer. In 2021, through a joint effort between a UVA's research team led by Dr. Luke Miller and the VDOE, they received this grant to leverage VLDS data and longitudinal administrative data from VDOE to examine student access to instructional opportunities and educational outcomes, and describe how COVID-19 may have influenced equity in student outcomes and differences in teacher outcomes across student characteristics.
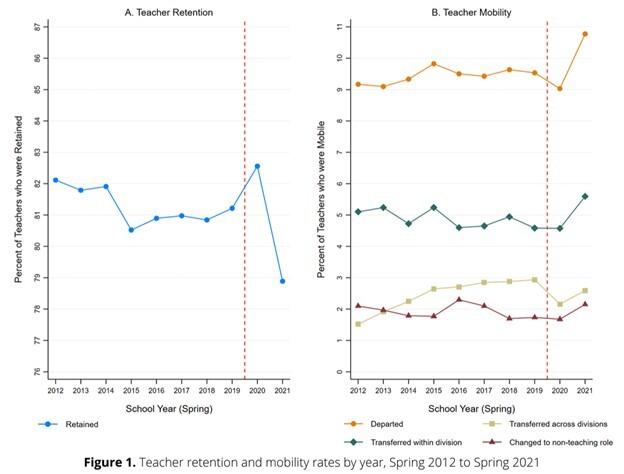 To date this research team has created a number of research papers and briefs, spanning a wide range of topics covering student mobility, students' transition to post-secondary education, student test-based performance, English Language proficiency, teacher retention and mobility, and trends in teacher licensure. For more information, please visit UVA's project site and VDOE's Statistics & Reports webpage.
|
|
|
Metropolitan Educational Research Consortium (MERC) Publishes Advanced Placement Report Using VLDS Data
MERC continues to explore students' participation in advanced coursework in Virginia elementary schools (gifted/talented programs), middle schools (Algebra I+), and high schools (Advanced Placement) to address enrollment equity. The study achieves two research aims: 1) to explore how advanced course-taking varies by student demographics, and 2) to understand how disparities in advanced course-taking vary by student demographics and intersectional identities.
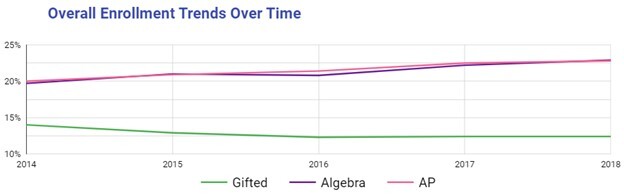 The findings indicate that disparities in advanced course-taking are related to students’ race, ethnicity, disability status, English learner (EL) status, socioeconomic status, as well as the intersection of these variables. The report includes implications for policies and practices that consider complex school system variables that affect advanced course enrollment. This report is part of MERC's
Equitable Access and Support for Advanced Coursework (EASAC) study.
To access an interactive version of the data in this report, including additional details about demographic comparisons for each academic year, please see
MERC data dashboard that accompanies this report.
|
|
Past Events
2024 SLDS P-20 Best Practices Conference
The 2024 SLDS Best Practices Conference was held May 2-3, 2024, in Washington, DC, with an optional preconference day on May 1. The conference brought together SLDS professionals from across the country to share challenges and successes related to their work on longitudinal data systems. Several VLDS staff members were able to attend this year to learn about current issues in longitudinal data system implementation and use. They also presented a session on Tableau Data Visualizations on Teacher Shortages and Incentives at the Virginia Department of Education.
|
|
|
|