
HERC Spotlight: September 2025
Veterans Health Administration sent this bulletin at 09/29/2025 01:00 PM EDT
Health Economics Spotlight
|
||
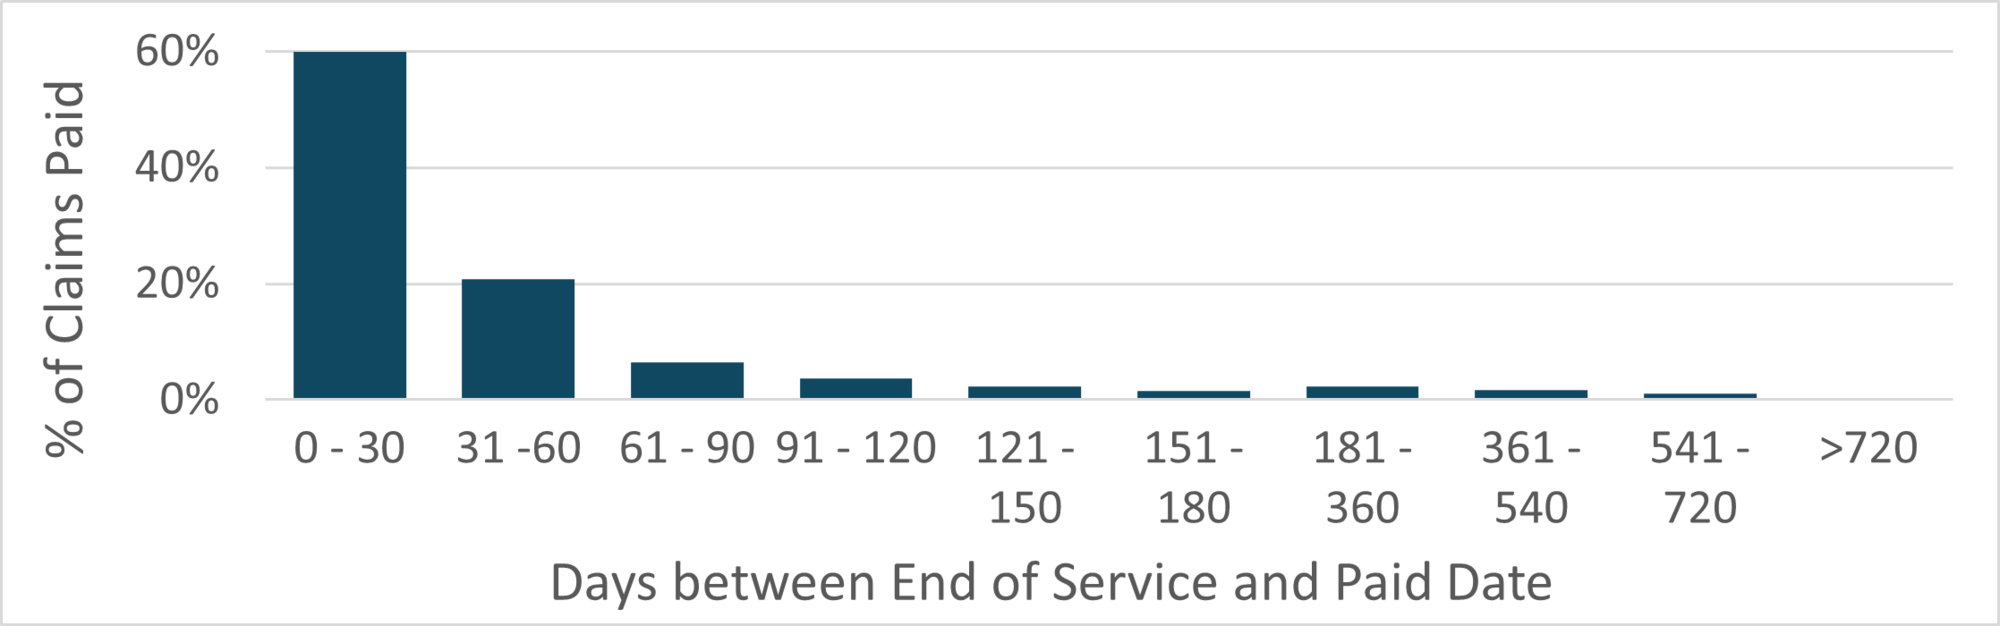
SpotlightClaim Processing Time for Community Care DataVA community care datasets report claims level information on non-VA care that was paid for by VA. Because community care datasets are derived from claims, there may be a delay in the time between the provision of care and the payment for care. A new HERC technical report presenting the claim processing time for claims in the VHA Office of Integrated Veteran Care Consolidated Data Sets (IVC CDS) to better understand the length of time data users should wait after service date before including CDS data in their analysis. The tech report summarizes the number of days between the service end date and the paid date for IVC CDS claims in FY2022. The authors focused on IVC CDS as it is the primary data source for VA community care beginning FY2019. Among all claims, the average time between the end of service and the paid date was 57 days. Dental claims had the quickest average processing time (49 days), followed by professional claims (55 days), and outpatient institutional claims (56 days). Inpatient institutional claims had the longest average processing time (159 days). Figure 1. Percentage of Claims Paid by 30-Day Increments
The team found that 90% of claims were paid within 112 days of service. For most analyses, including a 4-month lag period is sufficient. However, research focused on inpatient data should consider including additional lag time before including data in their analyses. Additional details are available in Technical Report 46: Including Lag Time for Community Care Data Analyses in VA Research. |
|||
SeminarUnderstanding VA Primary Care Work Load: Developing a new method using EMR timestampsHERC Econometrics Seminar Wednesday, October 22 at 1pm ET |
|||
Register |
|||
|
|
|||
|
VA’s workforce of 8,000 primary care clinicians face competing demands—growing secure messaging and care coordination across VA and community providers, pressure to keep more care in primary care before consulting specialists, and rising productivity / documentation requirements—often pushing work into after-hours “pajama time.” To expand access and increase productivity, VA has implemented bookable-time targets and work relative value unit (wRVU) tracking, but the effects on workload, productivity, and outcomes remain unclear. Because metrics like wRVUs can distort incentives, micro-level time-use data are needed to understand provider productivity and efficiency. Using EMR timestamps, our team developed a VA-specific time-tracking system and describe the methods and resulting dataset. All seminars are open to VA participants only until further notice. |
|||
PublicationsThe Economics of TelehealthA recent paper led by health economist Kritee Gujral synthesizes the evidence of telehealth’s impact on health care use, costs, effectiveness, and health equity using an economics lens. Below, we briefly summarize the paper, and the authors provide recommendations for future research based on their findings. |
|||
|
VA Leading the Way in a New Era for Telehealth Telehealth has long held substantial promise for improving health care access, but adoption had historically been limited by restrictive regulations. These regulations (Table 1) were loosened during the COVID-19 pandemic to enable widespread uptake. |
|||
|
VA has historically been a leader in telehealth, and this held true throughout the pandemic (Figure 1). In April 2020, 45% of VA health care visits occurred via phone and video telehealth, compared to 29% of Medicare,13% of private insurance, and 4%-18% of Medicaid claims, depending on the state. Figure 1. Percent of Services Delivered via Telehealth by Insurance Type, 2019-2021
Definitions of telehealth varied by insurer type. See Gujral 2025 for details. |
Policies Governing Telehealth Care Patient information sharing Licensing Provider reimbursement parity Patient cost-sharing Insurance coverage Coverage of audio-only telehealth Coverage of care types Coverage in home vs. medical settings Coverage in rural vs. urban areas For details of policy changes, see Table 1 in Gujral 2025. |
||
|
Supply- and Demand-Side Factors The authors reviewed demand- and supply-side factors affecting the adoption of telehealth. They examined whether telehealth is a substitute or complement to in-person care. They also examined the impact of telehealth on downstream use of costlier emergency and inpatient care. Overall, they found that telehealth adoption was associated with modest increases in total outpatient care, but evidence was sparsely distributed across care types (e.g., primary or specialty), telehealth modalities (e.g., audio, video, in-person), and pre- and post-pandemic periods. Rigorous studies are needed on comparative effectiveness of modalities, downstream costlier emergency and inpatient care, and efficiency gains in patient/provider time costs for a full economic picture. Based on this review, there are several possible directions for future VA research. |
|||
Directions for Future VA Research
|
|||
|
Citation: Gujral K, Illarmo S, Jacobs JC, Wagner TH. The Economics of Telehealth: An Overview. Telemedicine and e-Health. 2025 May 12. doi: 10.1089/tmj.2025.0073. |
|||
ResourcesComparing PAID and GovTA for VA Time and Attendance, Human Resources, and Payroll Processing DataVA staff and workload data can be a key source of information for research on VA employees. PAID and GovTA are two domains in CDW-Raw that provide detailed person-level staff information. While PAID was the original source of staffing data, VA began transitioning to a new timecard system (VATAS) in 2014, and these data were available in a separate domain: GovTA. This transition was not instantaneous, and the date when GovTA contains a complete capture of workload data varies by site. Currently, documentation about which domain to use is lacking. In this tech report, the authors examined the overlap between data in PAID and GovTA to provide guidance on which data source to use by year. They found that data are available in GovTA for many stations beginning in 2013, and by 2018, complete data are available in GovTA for most stations. Despite the transition to VATAS (GovTA), some data continued to flow into the PAID domain, and during the overlap period, neither system contained complete data capture. Therefore, for operations projects, the authors recommend using both PAID and GovTA during the overlap pay period and then relying on GovTA once it contains a complete capture of staffing and workload information. More information is available in Technical Report 47: Comparing PAID and GovTA for VA Time and Attendance, Human Resources, and Payroll Processing Data. This technical report is available on the VA intranet only. |
|||
Average Cost of VA Outpatient and Inpatient CareFor those looking to quickly estimate the cost of VA care, the HERC website includes the average cost of VA inpatient and outpatient care by year. All costs are calculated using HERC average cost data, and data are not adjusted for inflation. On the HERC Outpatient Average Cost Data page, visitors can find the average cost for 12 categories of outpatient care by year for FY2015-2024. The HERC Inpatient Average Cost Data page includes the average daily cost of VA inpatient care for 11 categories of care. The page includes both local average cost estimates and national average cost estimates. Both pages also list the codes included in each category of care. |
|||
Wage Index Updated for 2025Health care costs are more expensive in geographic areas that have higher wages (e.g., Boston or San Francisco). Therefore, researchers may need to adjust their cost analyses for these wage differences. The best known method involves using the Medicare wage index. To assist VA researchers, HERC creates a wage index specific to VA facilities. The wage index, updated for 2025, is saved as an excel file in the guidebook Medicare Wage Index for VA Facilities. |
|||
Data Q&AIdentifying ED Visits in VA DataQ: How do I identify emergency department visits in VA data? Emergency department (ED) visits are generally documented in outpatient data. Below are codes that HERC analysts commonly use to identify ED visits, including visits to urgent care (UC).
Please review all codes before applying them in an analysis. Codes may vary by study. Do you have a question about using VA cost data? HERC offers consultations to VA data users on a variety of health economics and data topics. Visit the HERC website to learn more about our consulting service. |
|||


|
Health Economics Resource Center (HERC) |
|
You have received this message because you are subscribed to VA Health Economics Resource Center. Access your Subscriber Preferences to make changes to your subscription or Unsubscribe. Get this as a forward? Sign Up to receive updates from HERC. Please do not reply as this email box is not monitored. To contact HERC please email herc@va.gov. |
||
 |