
U.S. Passenger Airline Employment Down in April 2021 from March
U.S. Department of Transportation sent this bulletin at 06/24/2021 11:01 AM EDT |
|
Having trouble viewing this email? View it as a Web page.
|
BTS 42-21
Thursday, June 23, 2021
Contact: Dave Smallen
david.smallen@dot.gov
U.S. Passenger Airline Employment Down in April 2021 from March
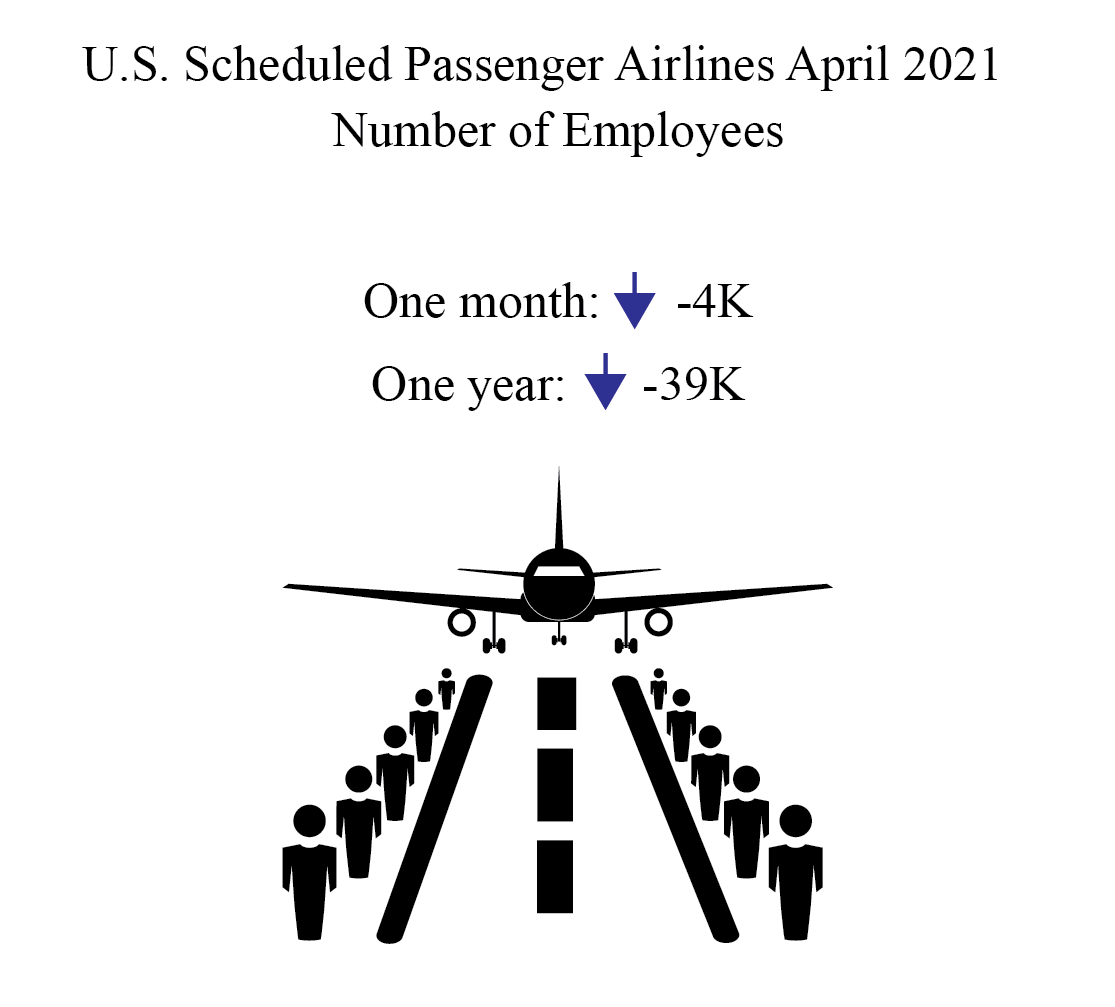
The 23 U.S. scheduled passenger airlines employed 0.9% fewer full-time equivalents (FTEs) in April 2021 than in March 2021:
- April’s total number of FTEs (391,501) was down 3,562 from March (395,063) and down 70,096, a 15.2% drop from the onset of the pandemic in March 2020 (461,597).
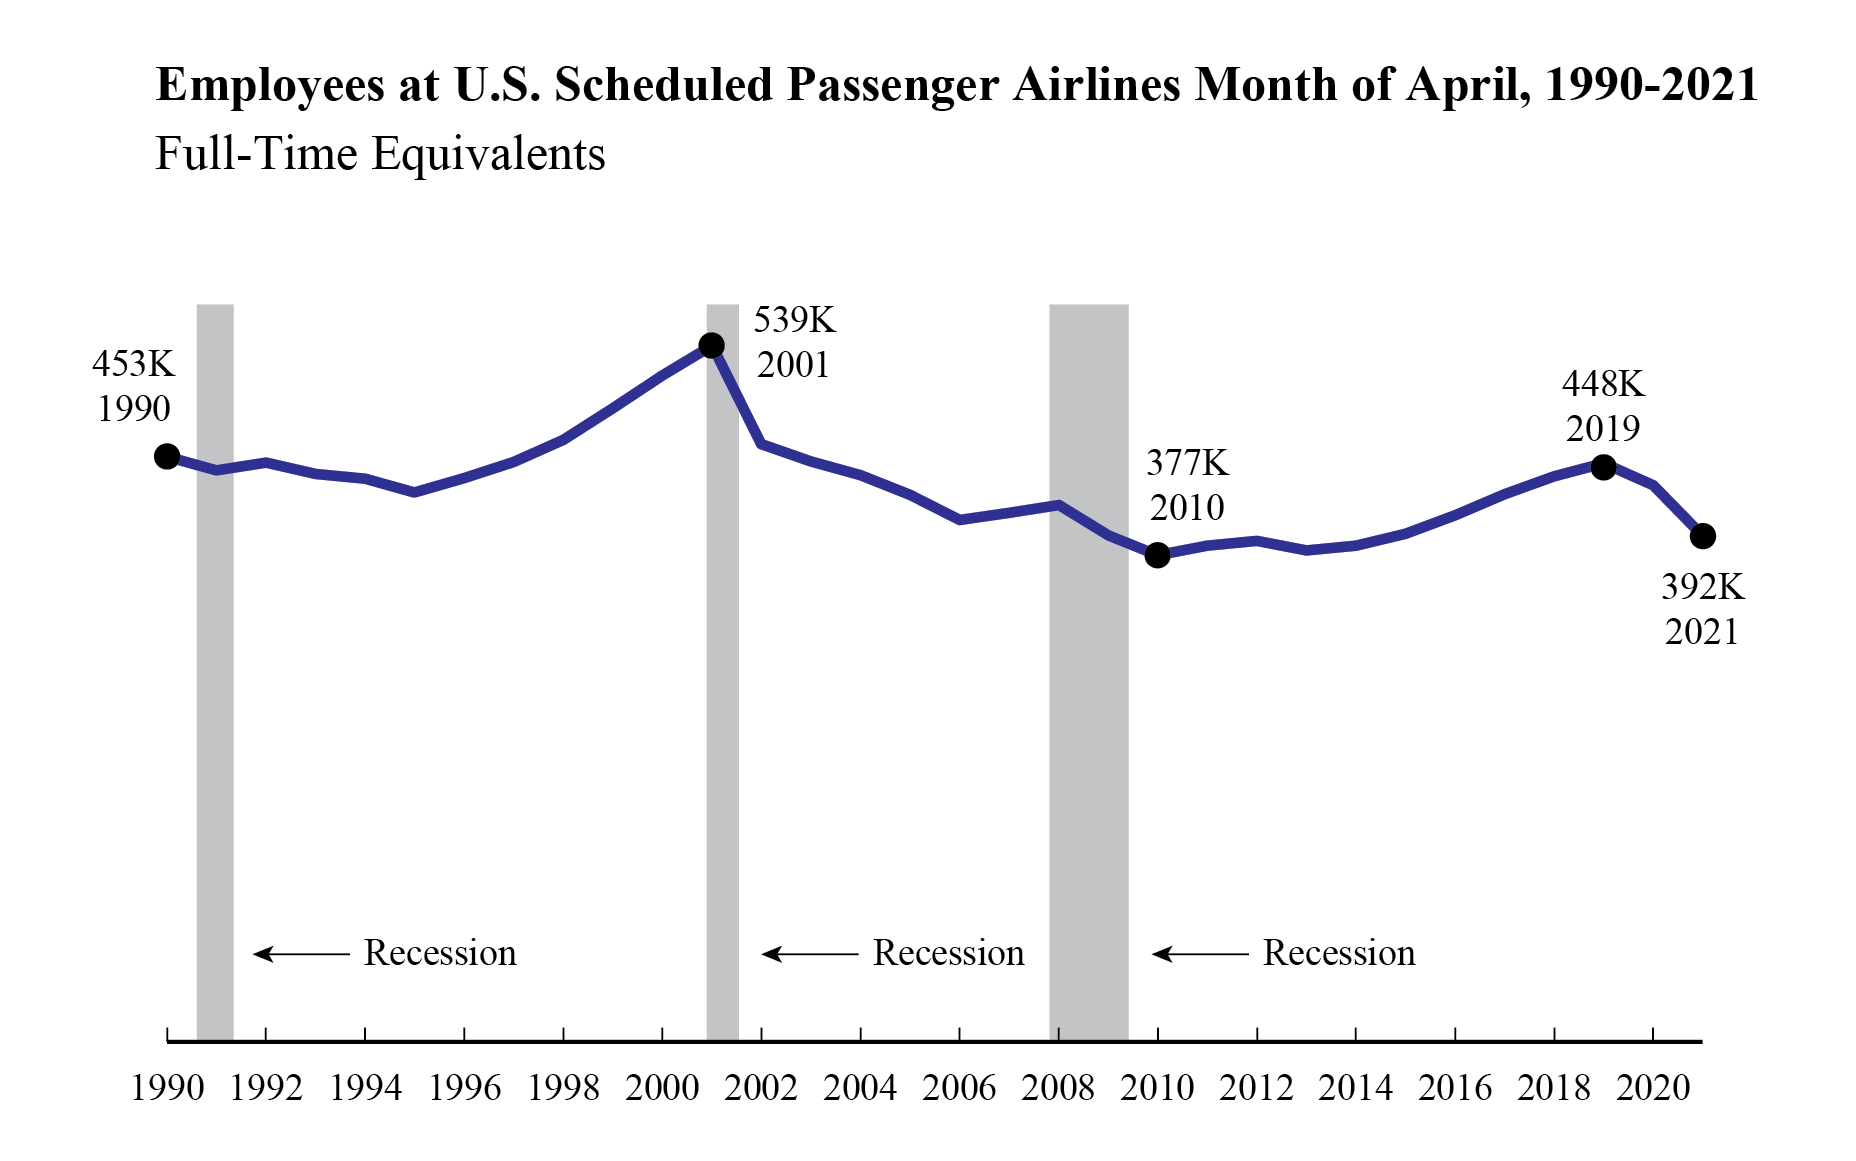
- April 2021 was the lowest FTE total for the month of April since 2014 (384,265).
April 2021, scheduled passenger airlines employed 60% of the total airline industry FTEs, down from 63% in March 2020. Total industry includes cargo and charter.
Regulations require U.S. airlines to report employment numbers for employees who worked or received pay for any part of the pay period(s) ending nearest the 15th day of the month. U.S. airline employment reports are filed monthly with the Bureau of Transportation Statistics. See the tables that accompany this release on the BTS website for detailed data since 2015 (Tables 1-15) and industry summary monthly data since 1990.
All 23 scheduled service passenger airlines (mid-April)
- 391,501 FTEs
- Down 9.1% (39,423 FTEs) from April 2020 (430,924 FTEs)
- Down 7.6% (32,246 FTEs) from April 2017 (423,747 FTEs)
Four network airlines (mid-April)
American Airlines, Delta Air Lines, United Airlines, Alaska Airlines
- 235,511 FTEs, 60.2% of total scheduled passenger airline FTEs
- Down 10.2% (26,789 FTEs) from April 2020 (262,300 FTEs)
- Down 14.7% (40,714 FTEs) from April 2017 (276,225 FTEs)
- Down 0.2% (570 FTEs) from March 2021 (236,081) FTEs
- Down 19.1% (55,698 FTEs) from March 2020 (291,209) FTEs
Network airlines operate a significant portion of their flights using at least one hub where connections are made for flights to down-line destinations or spoke cities. Note that beginning with January 2018 data, Virgin America’s numbers are included with Alaska Airlines in the network category.
Five low-cost airlines (mid-April)
Southwest Airlines, JetBlue Airways, Spirit Airlines, Frontier Airlines, Allegiant Air
- 90,373 FTEs, 23.1% of total scheduled passenger airline FTEs
- Down 8.4% (8,248 FTEs) from April 2020 (98,621 FTEs)
- Up 2.4% (2,084 FTEs) from April 2017 (88,289 FTEs)
- Down 0.4% (324 FTEs) from March 2021 (90,697) FTEs
- Down 8.3% (8,158 FTEs) from March 2020 (98,531) FTEs
Low-cost airlines operate under a low-cost business model, with infrastructure and aircraft operating costs below the overall industry average.
10 regional airlines (mid-April)
SkyWest Airlines, Envoy Air, Piedmont Airlines, Republic Airlines, Endeavor Air, PSA Airlines, Horizon Air, Mesa Airlines, Air Wisconsin Airlines, GoJet Airlines
- 58,397 FTEs, 14.9% of total scheduled passenger airline FTEs
- Down 3.7% (2,262 FTEs) from April 2020 (60,659 FTEs)
- Up 13.5% (6,959 FTEs) from April 2017 (51,438 FTEs)
- Down 3% (1,815 FTEs) from March 2021 (60,212 FTEs)
- Down 6.7% (4,170 FTEs) from March 2020 (62,567 FTEs)
Regional carriers typically provide service from small cities, using primarily regional jets to support the network carriers’ hub and spoke systems.
Top Employers by Group
- Network: American 93,552 FTEs
- Low-Cost: Southwest 55,721 FTEs
- Regional: SkyWest 14,917 FTEs
Four other airlines included in industry totals
Other carriers generally operate within specific niche markets. They are: Hawaiian Airlines, Sun Country Airlines, Silver Airlines and Eastern Airlines.
Reporting Notes
Airlines that operate at least one aircraft that has more than 60 seats or the capacity to carry a payload of passengers, cargo and fuel weighing more than 18,000 pounds must report monthly employment statistics.
Data are compiled from monthly reports filed with BTS by commercial air carriers as of June 7. Additional airline employment data and previous releases can be found on the BTS website. BTS has scheduled release of May 2021 passenger airline employment data for July 19.
|
You are subscribed to DOT email updates. Subscriber Services: Manage Preferences |
|
||||||||||||
