
March 2020 U.S. Airline Cargo Data (Preliminary): International Cargo Weight Down 14%
U.S. Department of Transportation sent this bulletin at 05/21/2020 11:08 AM EDT |
|
Having trouble viewing this email? View it as a Web page.
|
March 2020 U.S. Airline Cargo Data (Preliminary): International Cargo Weight Down 14%
U.S. airlines carried 1.4% less cargo by weight in March 2020 than in March 2019, according to preliminary data filed with the Bureau of Transportation Statistics (BTS) by 15 of the leading cargo airlines.
The 15 airlines carry more than 95% of the total cargo by weight on U.S. airlines. Cargo data consists of freight and mail carried within the U.S. and between the U.S. and foreign points.
March 2020 cargo numbers for the 15 carriers:
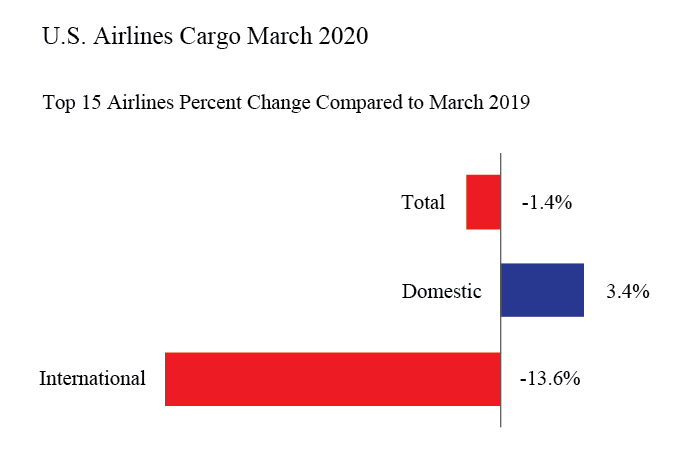
- Total: 1,455 thousand tons, down 1.4% from March 2019 (1,475T tons)
- Domestic: 1,098 thousand tons, up 3.4% from March 2019 (1,062T tons)
- International: 357 thousand tons, down 13.6% from March 2019 (413T tons)
U.S. air cargo reports are filed monthly with BTS. Final March data will be released on June 11. Complete international data by origin and destination will be released on September 11.
Systemwide Cargo (Domestic + International)
March 2020 would be the third consecutive month and the sixth month in the last seven that the total weight of cargo on U.S. airlines declined from the same month of the previous year. The 1.4% decrease from March 2019 was larger than the decreases from 2019 in both January (-0.5%) and February (-0.1%).
Table 1: Systemwide Percent Change in US Airlines Cargo by Weight from the Same Month of the Previous Year 2016-2020
Cargo = Freight + Mail
|
Year-to-Year Percent Change |
||||
|
|
2016-2017 |
2017-2018 |
2018-2019 |
2019-2020 |
|
January |
6.4 |
10.5 |
5.1 |
-0.5 |
|
February |
6.1 |
9.2 |
-0.3 |
-0.1 |
|
March |
8.0 |
5.8 |
-0.2 |
-1.4* |
|
April |
2.6 |
5.9 |
4.4 |
|
|
May |
10.8 |
9.0 |
3.1 |
|
|
June |
6.8 |
5.5 |
-1.1 |
|
|
July |
6.9 |
6.7 |
3.5 |
|
|
August |
9.7 |
5.0 |
0.2 |
|
|
September |
4.3 |
5.0 |
-4.4 |
|
|
October |
10.6 |
5.5 |
-1.2 |
|
|
November |
10.6 |
-0.6 |
-2.3 |
|
|
December |
5.6 |
0.3 |
0.7 |
|
|
Annual |
7.4 |
5.4 |
0.6 |
|
Source: Bureau of Transportation Statistics, T-100 Market
* March 2020 data is preliminary
Domestic Cargo
March 2020 would be the fourth consecutive month that the weight of domestic cargo on U.S. airlines rose from the same month of the previous year. The 3.4% increase from March 2019 was larger than the increases from 2019 in both January (2.8%) and February (2.2%). The December 2018 to December 2019 increase was larger at 4.5%
Table 2: Domestic Percent Change in US Airlines Cargo by Weight from the Same Month of the Previous Year 2016-2020
Domestic cargo has a U.S. origin and U.S. destination
Cargo = Freight + Mail
|
Year-to-Year Percent Change |
||||
|
|
2016-2017 |
2017-2018 |
2018-2019 |
2019-2020 |
|
January |
4.6 |
10.4 |
6.1 |
2.8 |
|
February |
4.9 |
8.7 |
0.7 |
2.2 |
|
March |
7.1 |
4.0 |
-0.4 |
3.4* |
|
April |
1.5 |
4.9 |
7.7 |
|
|
May |
10.8 |
8.9 |
4.5 |
|
|
June |
5.4 |
4.5 |
0.5 |
|
|
July |
5.2 |
6.7 |
6.2 |
|
|
August |
9.4 |
4.8 |
0.1 |
|
|
September |
3.3 |
4.3 |
-2.9 |
|
|
October |
11.1 |
5.7 |
1.8 |
|
|
November |
11.3 |
-0.1 |
-1.8 |
|
|
December |
5.1 |
0.1 |
4.5 |
|
|
Annual |
6.7 |
5.0 |
2.2 |
|
Source: Bureau of Transportation Statistics, T-100 Domestic Market
* March 2020 data is preliminary
International Cargo
U.S. airlines cargo declined 13.6% by weight in March 2020 from March 2019, the largest of seven consecutive year-to-year declines.
Table 3: International Percent Change in US Airlines Cargo by Weight from the Same Month of the Previous Year 2016-2020
International cargo on a U.S. airline is carried between a U.S. airport and a foreign airport.
Cargo = Freight + Mail
|
Year-to-Year Percent Change |
||||
|
|
2016-2017 |
2017-2018 |
2018-2019 |
2019-2020 |
|
January |
11.4 |
10.6 |
2.2 |
-9.8 |
|
February |
9.6 |
10.4 |
-3.1 |
-6.3 |
|
March |
10.5 |
10.7 |
0.4 |
-13.6* |
|
April |
5.3 |
8.2 |
-3.9 |
|
|
May |
11.0 |
9.2 |
-0.6 |
|
|
June |
10.8 |
8.2 |
-5.2 |
|
|
July |
11.3 |
6.7 |
-3.6 |
|
|
August |
10.6 |
5.6 |
0.4 |
|
|
September |
7.2 |
7.0 |
-8.3 |
|
|
October |
9.4 |
5.0 |
-8.7 |
|
|
November |
8.8 |
-1.8 |
-3.5 |
|
|
December |
7.2 |
0.9 |
-10.6 |
|
|
Annual |
9.4 |
6.5 |
-3.8 |
|
Source: Bureau of Transportation Statistics, T-100 International Market
* March 2020 data is preliminary
Reporting Notes
Data are compiled from monthly reports filed with BTS by commercial U.S. air carriers detailing operations, passenger traffic and freight traffic. This release includes data received by BTS from 15 U.S. airlines as of May 5.
See the BTS Airlines and Airports page for additional U.S. airlines numbers through February for U.S. airlines. International data by origin and destination is available through November.
BTS has scheduled June 11 for the release of reported data through March.
None of the data are from samples. Measures of statistical significance do not apply to the complete air traffic data.
|
You are subscribed to DOT email updates. Subscriber Services: Manage Preferences |
|
||||||||||||
