
January 2020 U.S. Airline Freight Data (Preliminary)
U.S. Department of Transportation sent this bulletin at 04/02/2020 11:06 AM EDT |
|
Having trouble viewing this email? View it as a Web page.
|
January 2020 U.S. Airline Freight Data (Preliminary)
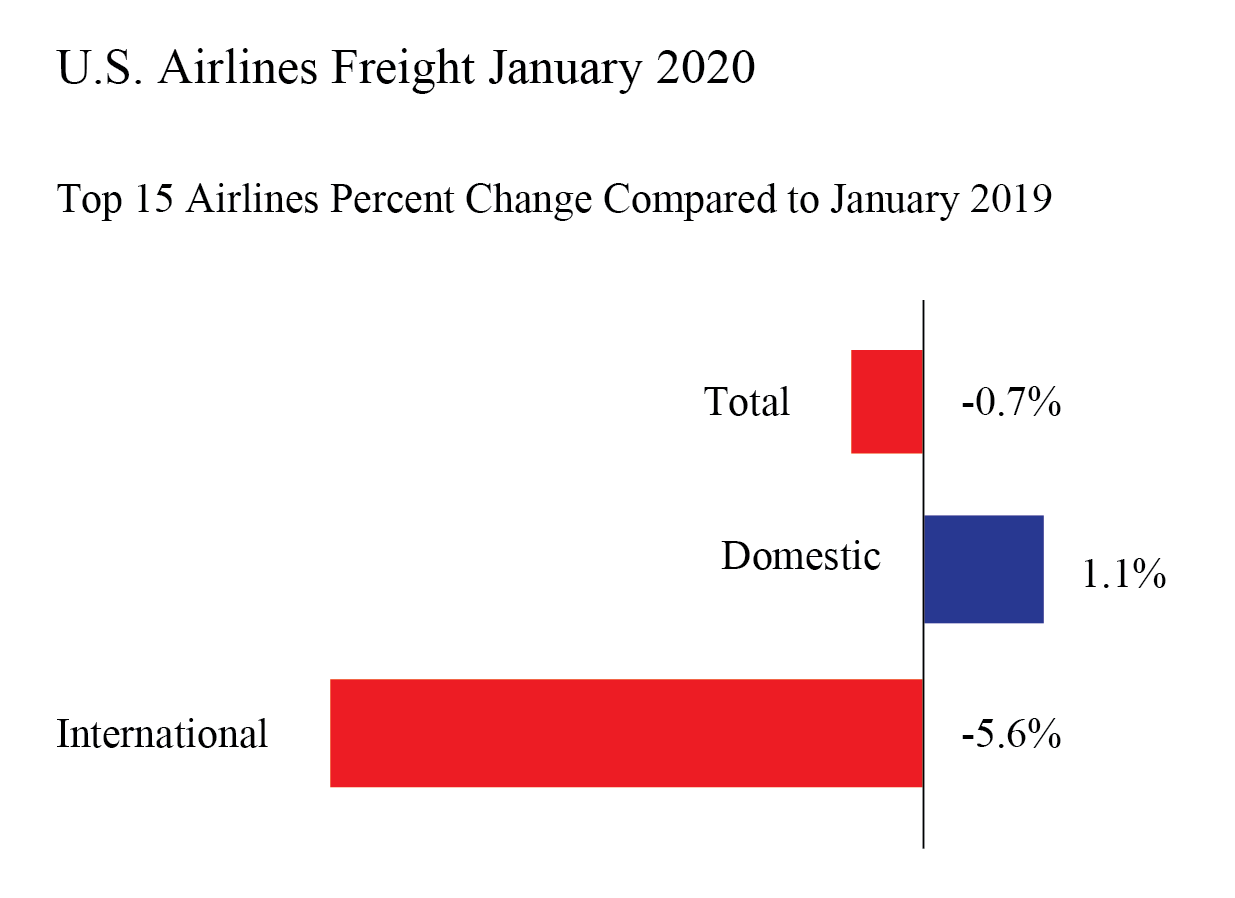
U.S. airlines carried 0.7% less freight by weight in January 2020 than in January 2019, according to preliminary data filed with the Bureau of Transportation Statistics (BTS) by the 15 airlines that carry the most freight.
The 15 airlines carry 97% of the total freight by weight on U.S. airlines.
January 2020 freight numbers for 15 carriers carrying the most freight (by weight):
- Total: 370 million tons in January 2020, down 0.7% from January 2019 (1.379M tons)
- Domestic: 1.019 million tons in January 2020, up 1.1% from January 2019 (1.008M tons)
- International: .351 million tons in January 2020, down 5.6% from January 2019 (.372M tons)
U.S. air cargo reports are filed monthly with BTS. Final January data will be released on April 16. Complete international data by origin and destination will be released on July 16. Freight data consists of freight carried within the U.S. and between the U.S. and foreign points.
Systemwide Freight (Domestic + International)
January 2020 would be the fourth month in the last five months in which the weight of freight on U.S. airlines declined from the same month of the previous year. The 0.7% decrease in freight weight from January 2019 reversed a 0.6% increase from December 2018 to December 2019. It was a smaller decline than the year-to-year decrease in each of the months from September through November.
Table 1: Systemwide Percent Change in US Airlines Freight by Weight from the Same Month of the Previous Year 2017-2020
|
Year-to-Year Percent Change |
||||
|
|
2016-2017 |
2017-2018 |
2018-2019 |
2019-2020 |
|
January |
6.6 |
10.4 |
5.5 |
-0.7* |
|
February |
5.9 |
9.3 |
-0.4 |
|
|
March |
7.2 |
5.9 |
0.3 |
|
|
April |
1.6 |
6.1 |
4.6 |
|
|
May |
10.1 |
9.3 |
3.4 |
|
|
June |
6.4 |
5.8 |
-1.0 |
|
|
July |
6.7 |
7.2 |
3.6 |
|
|
August |
9.4 |
5.5 |
0.2 |
|
|
September |
4.2 |
5.4 |
-4.5 |
|
|
October |
10.6 |
6.0 |
-1.4 |
|
|
November |
10.8 |
-0.3 |
-2.5 |
|
|
December |
5.5 |
0.6 |
0.6 |
|
|
Annual |
7.1 |
5.7 |
0.6 |
|
Domestic Freight
January 2020 would be the second consecutive month in which the weight of domestic freight on U.S. airlines rose from the same month of the previous year. The 1.1% increase in freight from January 2019 would be smaller than the 4.6% increase from December 2018 to December 2019. From November 2018 to November 2019 the amount of freight carried declined by 2.0%.
|
Year-to-Year Percent Change |
||||
|
|
2016-2017 |
2017-2018 |
2018-2019 |
2019-2020 |
|
January |
4.8 |
10.3 |
6.6 |
1.1 |
|
February |
4.5 |
8.8 |
0.6 |
|
|
March |
5.9 |
4.2 |
0.1 |
|
|
April |
0.1 |
5.1 |
8.1 |
|
|
May |
9.6 |
9.2 |
4.8 |
|
|
June |
4.7 |
4.8 |
0.6 |
|
|
July |
4.8 |
7.2 |
6.5 |
|
|
August |
8.9 |
5.4 |
0.2 |
|
|
September |
3.1 |
4.6 |
-2.9 |
|
|
October |
11.1 |
6.3 |
1.6 |
|
|
November |
11.5 |
0.2 |
-2.0 |
|
|
December |
5.0 |
0.4 |
4.6 |
|
|
Annual |
6.2 |
5.3 |
2.4 |
|
International Freight
January 2020 would be the fifth consecutive month in which the weight of international freight on of U.S. airlines declined from the same month of the previous year. The 5.6% decrease in freight from January 2019 was smaller than the 10.8% increase from December 2018 to December 2019. It was larger than the 3.7% decline from November 2018 to November 2019.
|
Year-to-Year Percent Change |
||||
|
|
2016-2017 |
2017-2018 |
2018-2019 |
2019-2020 |
|
January |
11.8 |
10.7 |
2.5 |
-5.6 |
|
February |
9.9 |
10.6 |
-3.0 |
|
|
March |
10.8 |
10.7 |
0.8 |
|
|
April |
5.5 |
8.3 |
-3.7 |
|
|
May |
11.3 |
9.4 |
-0.4 |
|
|
June |
11.0 |
8.5 |
-5.1 |
|
|
July |
11.6 |
7.1 |
-3.7 |
|
|
August |
10.8 |
5.9 |
0.3 |
|
|
September |
7.3 |
7.3 |
-8.5 |
|
|
October |
9.6 |
5.2 |
-9.0 |
|
|
November |
8.9 |
-1.7 |
-3.7 |
|
|
December |
7.1 |
1.2 |
-10.8 |
|
|
Annual |
9.5 |
6.7 |
-3.8 |
|
Reporting Notes
Data are compiled from monthly reports filed with BTS by commercial U.S. air carriers detailing operations, passenger traffic and freight traffic. This release includes data received by BTS from 15 U.S. airlines as of March 3.
See the BTS Airlines and Airports page for additional U.S. airlines numbers through December for U.S. airlines. International data by origin and destination is available through September.
BTS has scheduled April 16 for the release of reported data through January.
None of the data are from samples. Measures of statistical significance do not apply to the complete air traffic data.
|
You are subscribed to DOT email updates. Subscriber Services: Manage Preferences |
|
||||||||||||
