
Estimated September 2019 U.S. Airline Traffic Data
U.S. Department of Transportation sent this bulletin at 10/10/2019 11:02 AM EDT |
|
Having trouble viewing this email? View it as a Web page.
|
Estimated September 2019 U.S. Airline Traffic Data
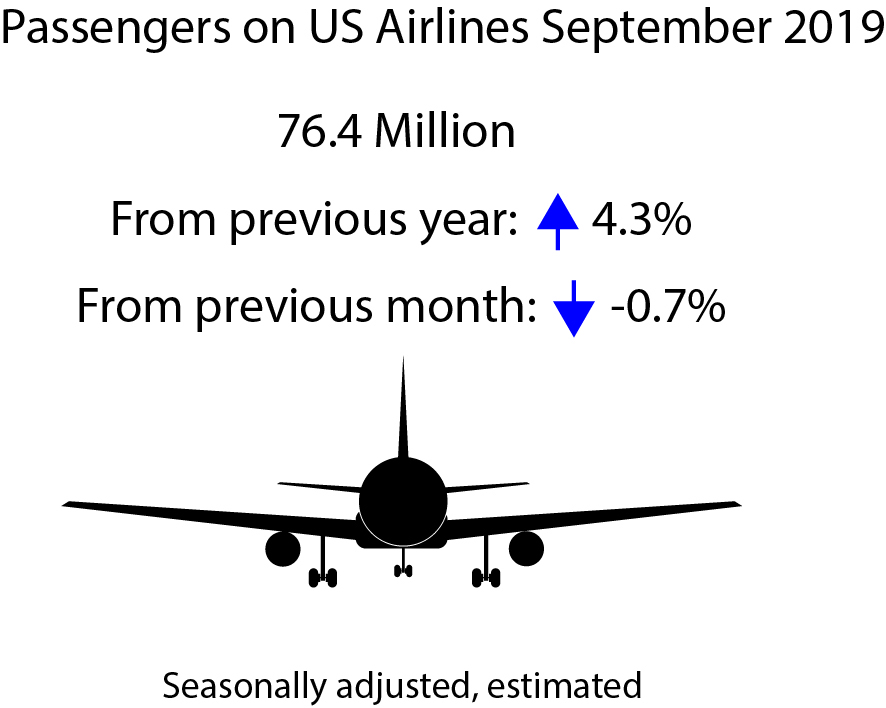
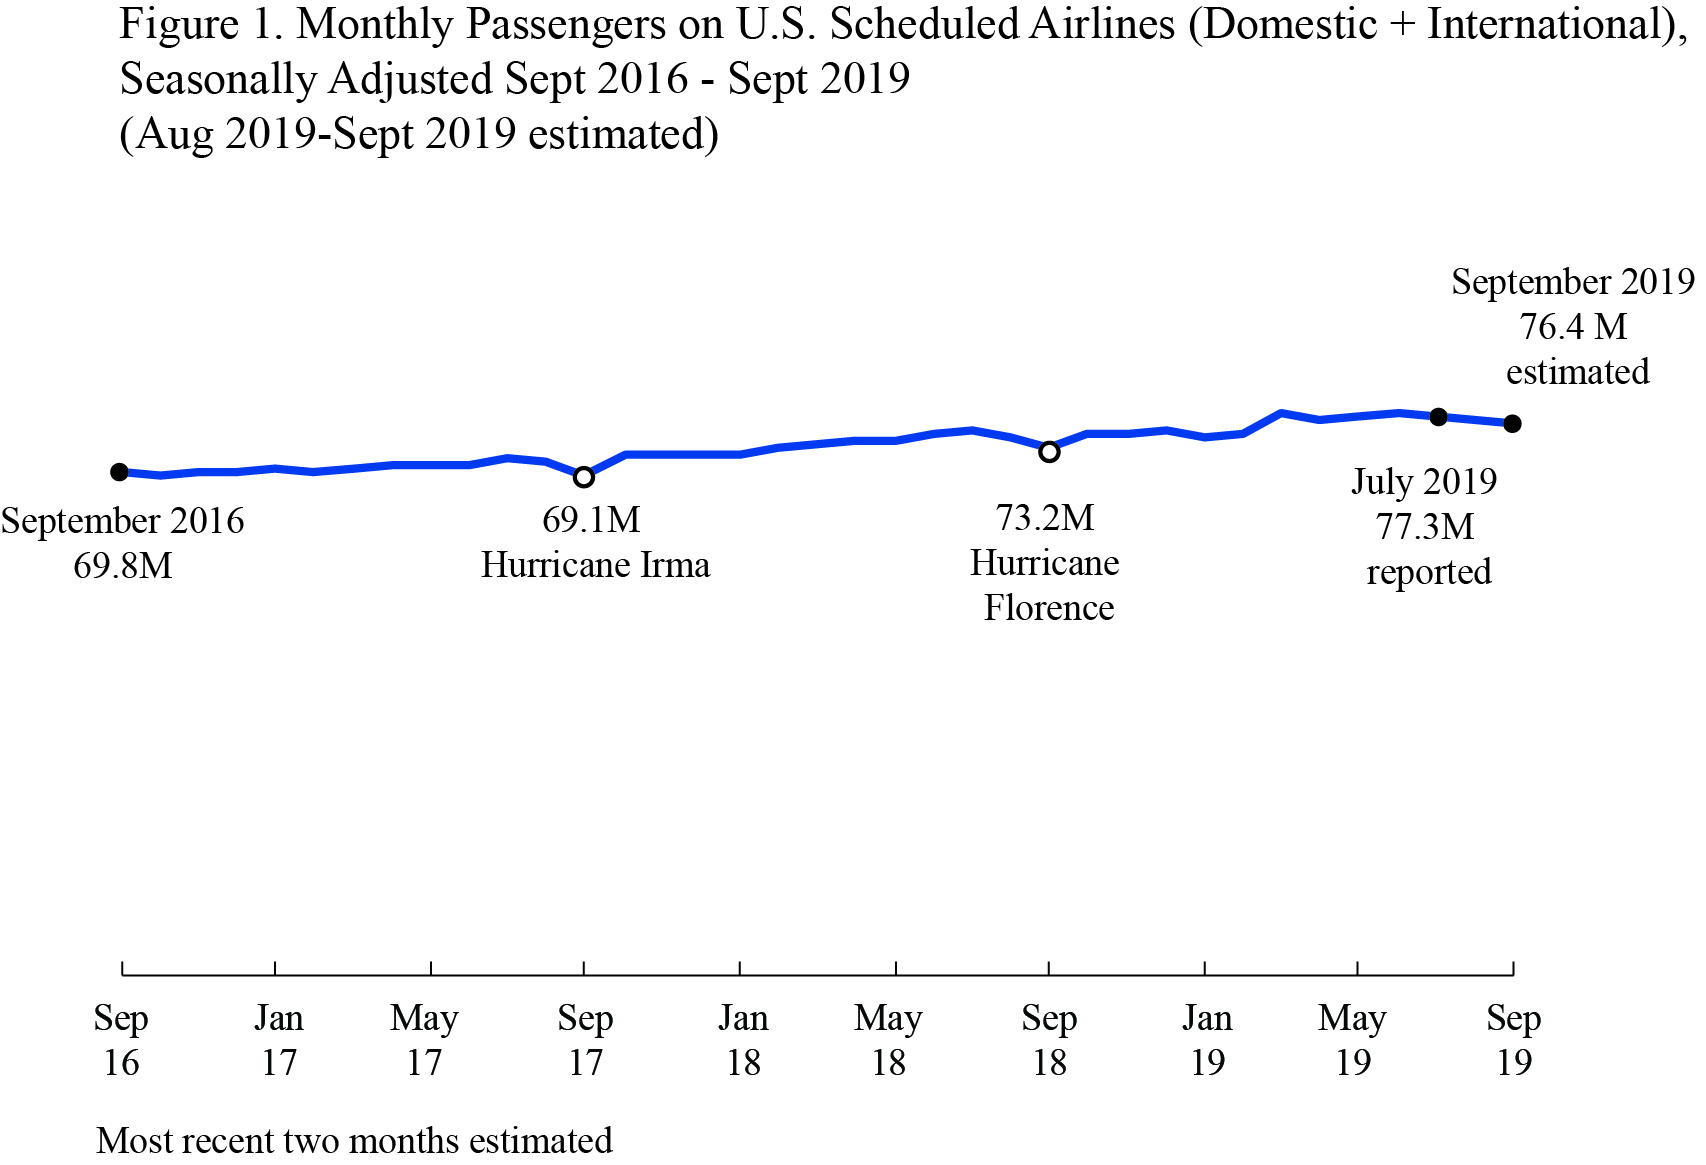
U.S. airlines carried an estimated 76.4 million systemwide (domestic and international) scheduled service passengers in September 2019, seasonally adjusted, according to the Bureau of Transportation Statistics’ (BTS) first estimate, down 0.7% from the August second estimate.
The BTS estimate of the September enplanement total of 76.4 million was down 1.7% from the all-time, seasonally adjusted, reported high of 77.7 million reached in June 2019.
The 76.4 million systemwide passengers included an estimated 67.0 million domestic passengers and 9.4 million international passengers on U.S. airlines flights in September.
U.S. airline traffic reports are filed monthly with BTS. See the tables that accompany this release on the BTS website for summary data since 2016 (Tables 1-24) and complete data since 2000.
This release is a statistical estimate based on U.S. airlines reported data through July. BTS will release a second estimate of U.S. airlines September air traffic on Nov 15, followed by a release of the reported data on Dec 12.
Four measures of U.S. airlines passenger enplanements
Estimated September seasonally adjusted
- System-wide enplanements were down 1.7% from the all-time, seasonally-adjusted, reported high of 77.7 million reached in June 2019.
- Domestic enplanements were down 1.4% from the all-time, seasonally-adjusted, reported high of 68.0 million reached in March 2019.
- International enplanements were down 4.1% from the all-time, seasonally-adjusted, reported high of 9.76 million reached in June 2019.
Reported July seasonally adjusted
- System-wide enplanements (77.3M) were down 0.6% from the all-time, seasonally-adjusted, reported high of 77.7 million reached in June 2019.
- Domestic enplanements (67.8M) were down 0.4% from the all-time, seasonally-adjusted, reported high of 68.0 million reached in March 2019.
- International enplanements (9.51M) were down 2.6% from the all-time, seasonally-adjusted, reported high of 9.76 million reached in June 2019.
Estimated September unadjusted
- Systemwide enplanements (71.9M) reached a new estimated all-time high for the month of September, up 4.7% from September 2018.
- Domestic enplanements (63.6M) reached a new estimated all-time high for the month of September, up 5.1% from September 2018.
- International enplanements (8.37M) reached a new estimated all-time high for the month of September, up 1.7% from September 2018.
Reported July unadjusted
- Systemwide enplanements (85.4M) reached a new reported all-time high for any month, up 1.7% from the previous high in July 2018.
- Domestic enplanements (73.8M) reached a new reported all-time high for any month, up 1.5% from the previous high in June 2019.
- International enplanements (11.55M) reached a new reported all-time high for any month, up 1.1% from the previous high in July 2018.
Table A. Estimated and Reported Passenger Enplanements Compared to Previous Time Periods
|
Seasonally Adjusted |
Passengers (in millions) |
Percent Change Compared to |
||
|
Previous Month |
Previous Year |
Three Years Previous |
||
|
September estimate |
76.4 |
-0.7% |
4.3% |
9.4% |
|
July reported |
77.3 |
-0.6% |
2.2% |
13.0% |
Table B. Unadjusted Estimated and Reported Passenger Enplanements Compared to Previous Time Periods
|
Unadjusted |
Passengers (in millions) |
Percent Change Compared to |
||
|
Previous Year |
Two Years Previous |
Three Years Previous |
||
|
September estimate |
71.9 |
4.7% |
10.8% |
8.2% |
|
July reported |
85.4 |
1.7% |
7.0% |
11.1% |
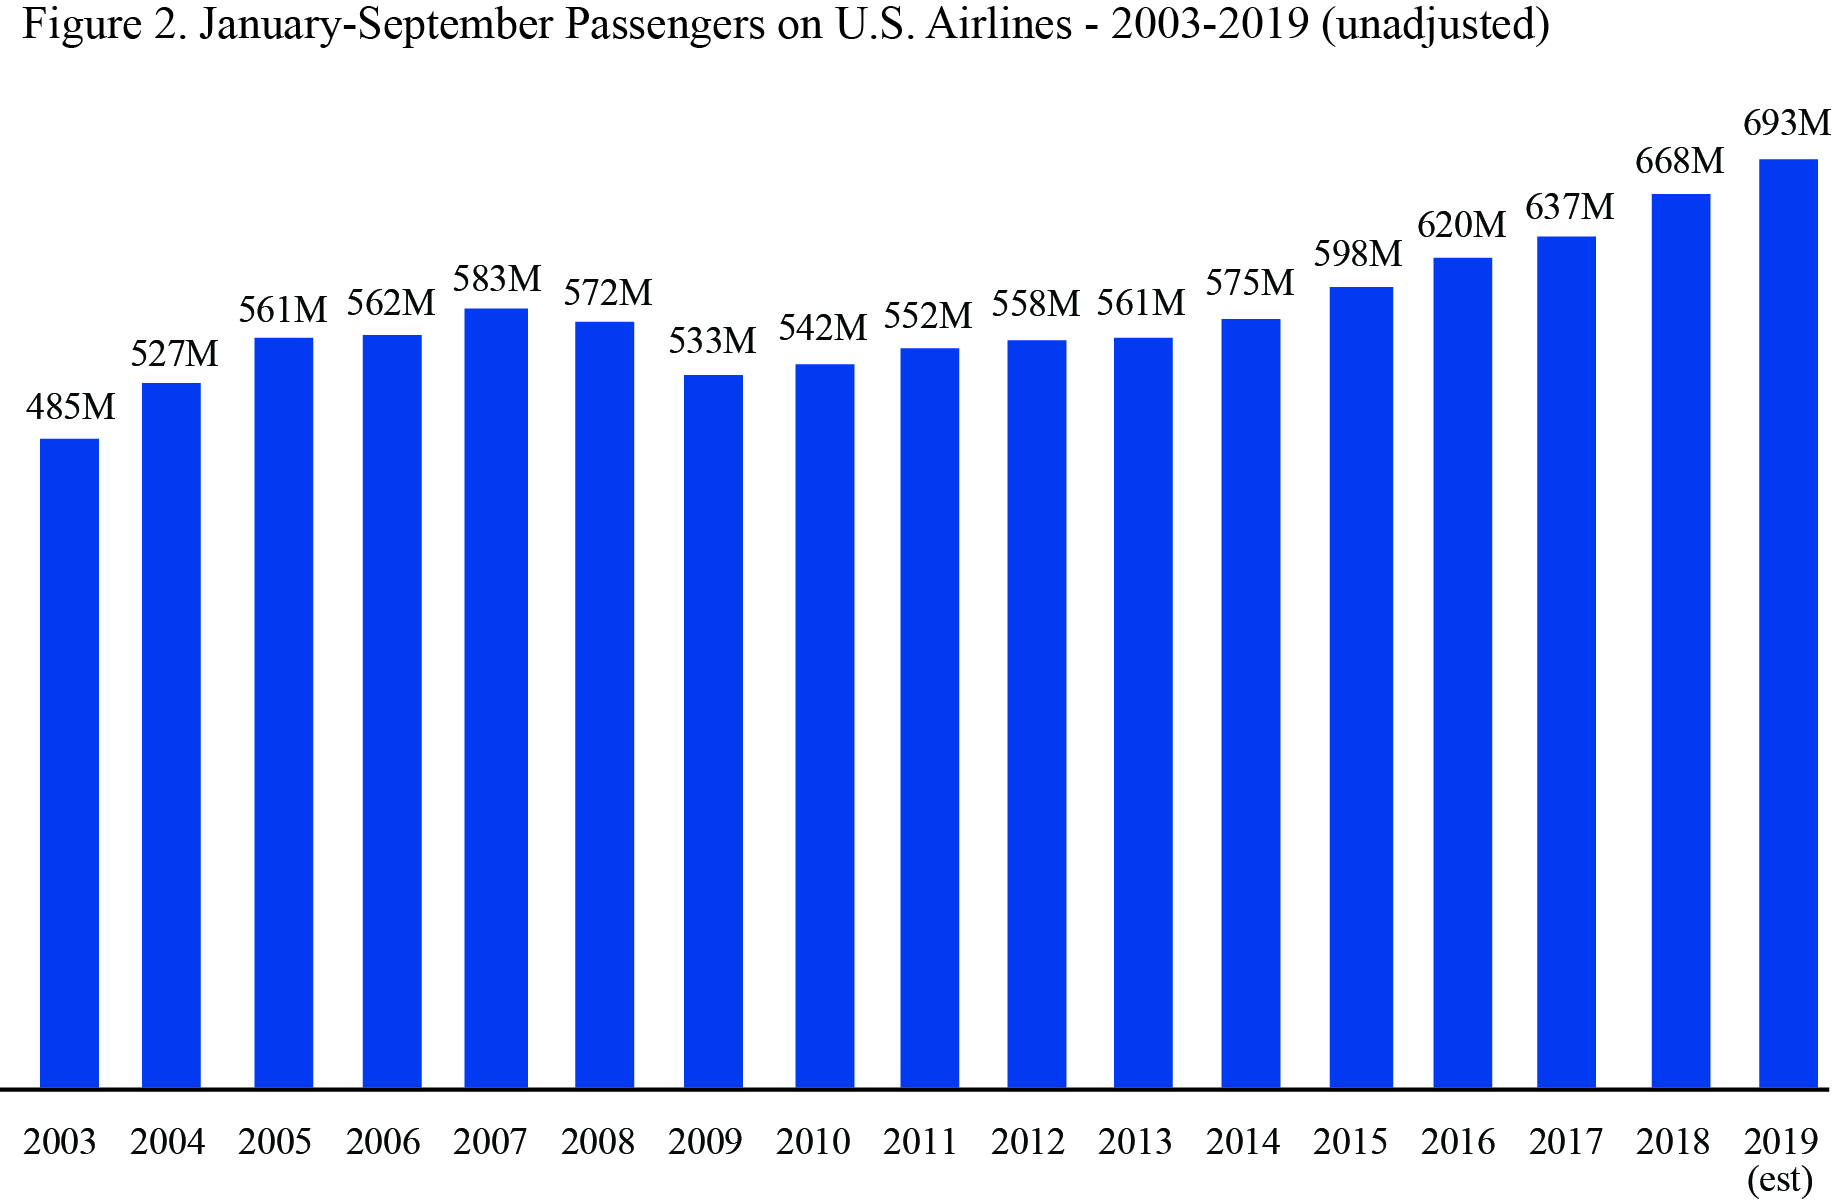
Year-to-Date
For the first nine months of 2019, January through September, U.S. airlines carried 692.8 million passengers, the highest total based on comparable records since 2003. The January-September number has reached a new high for five consecutive years. The 2019 eight-month number is up 3.7% from 2018, up 8.8% from 2017 and up 11.8% from 2016. Numbers are unadjusted with 2019 consisting of seven months reported data and two months estimated.
For the August and September estimates and for data filed through July, see accompanying tables. For the complete database of reported data, see Traffic. For an explanation of BTS’ seasonal adjustment methodology, see Seasonal Adjustment.
BTS Estimates
For seasonally-adjusted passenger numbers, BTS first estimates have averaged within 0.8% of reported data while second estimates have averaged within 0.6% of reported data.
For unadjusted passenger numbers, BTS first estimates have averaged within 1.0% of reported data while second estimates have averaged within 0.7% of reported data.
For an explanation of BTS’ estimate methodology see Air Traffic Methodology.
Reporting Notes
Data are compiled from monthly reports filed with BTS by commercial U.S. air carriers detailing operations, passenger traffic and freight traffic. This release includes data received by BTS from 74 U.S. carriers as of Oct. 1 for U.S. carrier scheduled civilian operations.
See the BTS Airlines and Airports page for additional scheduled service numbers through July for U.S. airlines. International data by origin and destination is available through April.
BTS has scheduled Nov 15 for the release of the first estimate of October air traffic data, the second estimate of September air traffic data and reported data through August.
None of the data are from samples. Measures of statistical significance do not apply to the complete air traffic data.
|
You are subscribed to DOT email updates. Subscriber Services: Manage Preferences |
|
||||||||||||
