|

Welcome back to school with USGS Water Science
As a new school year begins, the USGS Water Science School is excited to support educators with fresh, classroom‑ready water science resources. From hands‑on activities to real‑world data explorations, we’re here to help you spark curiosity, build science literacy, and connect students with the water systems shaping their world.
✨ We hope you enjoy this issue, packed with educator‑focused resources designed to inspire discovery and make water science engaging in every classroom.
📬 Thank you for being part of our growing educator community. If you know others who would be interested in subscribing, please share this link.
|
|
The USGS Water Science School offers a growing collection of free, Next Generation Science Standards (NGSS) ‑ aligned lesson plans and hands‑on activities designed to help educators bring real‑world water science into the classroom. These resources blend interactive visualizations, authentic USGS data, and inquiry‑based learning to make complex earth science concepts accessible and engaging for K-12 students. Whether exploring the water cycle, investigating drought and streamflow, or analyzing how wildfires affect water, each activity supports critical thinking, data literacy, and meaningful connections to students’ everyday environments. |
|
Grade Level: 6–12
Time: 50 Minutes
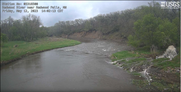
In this activity, students will examine time‑series images from a USGS HIVIS camera to observe environmental change, analyze patterns in stream and weather conditions, compare visual observations with real‑time USGS water data, interpret hydrologic graphs, and develop evidence‑based explanations for how streams respond to various factors.
|
Grade Level: 6–12
Time: 30 Minutes
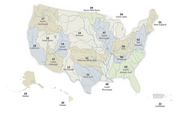
In this activity, students will explore what watersheds are and why they matter, learn how Hydrologic Unit Codes (HUCs) describe watershed scales, use USGS tools to identify the HUC for a chosen location, and compare local and regional watersheds to understand how water connects communities.
|
Grade Level: 6–12
Time: 50 Minutes
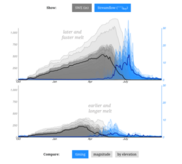
In this activity students investigate how snowpack acts as a natural water storage system and how changes in snow accumulation and melt timing affect streamflow and water availability in the Western United States. Using a USGS interactive visualization and real monitoring data, students will analyze trends, interpret hydrologic variables, and evaluate downstream impacts on people and ecosystems. This activity aligns with NGSS for high school science education.
|
Grade Level: 6–12
Time: 10-20 minutes
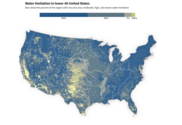
The USGS Water Resources Mission Area has assessed how much water is available for human and ecological needs in the United States and identified where and when the Nation may have challenges meeting its demand for water through the National Water Availability Assessment Report (NWAA). An interactive website was created to highlight key scientific findings of the NWAA report through engaging stories, plain-language explanations, and interactive data visualizations. In these short activities we will go through each of the key finding’s webpages to try to better understand the data in the report and visualizations.
|
Grade Level: 6–12
Time: 50 Minutes
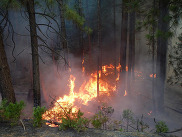
In this activity students will learn how wildfires impact watersheds and water quality and think critically about how people and communities can adapt to these changes.
|
Grade Level: 6–12
Time: 50 Minutes
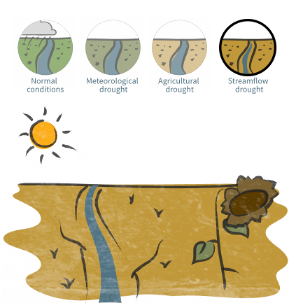
Students will learn what streamflow drought is, how it has affected the United States over time, and how people and communities adapt to drought conditions. Students will use interactive USGS visualizations to explore the science of streamflow drought, analyze historical and real-world data, and think critically about water management. This activity aligns with NGSS for high school science education.
|
Grade Level: 6–12
Time: 50 Minutes - 3 hours
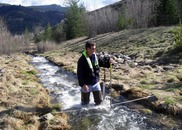
An interactive app that explains streamflow; what it is, how we measure it and what does this look like in a real world context. The app guides you through activities that explain why streamflow is important and offers multiple opportunities to collect your own data, either outdoors or by using real USGS streamflow data.
|
Grade Level: K-5
Time: 30 Minutes
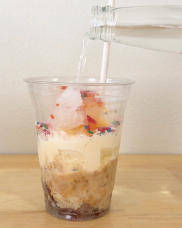
The Edible Aquifer activity is a hands‑on, food‑based model that helps students visualize how groundwater is stored and moves through different types of aquifers. Using layered ingredients to represent rock, sand, soil, and water, students explore concepts like the water table, recharge, confined vs. unconfined aquifers, and how pollution can spread through groundwater systems. This interactive activity supports NGSS standards and provides an engaging way to understand real-world hydrogeology.
|
|
|
The USGS’s Virtual Classroom Visits (VcV) program connects our scientists with classrooms across the Nation, through virtual meeting technology. VcV allows USGS scientists to pop in to schools that are not just around the corner.
Sign up now!
|
|
|
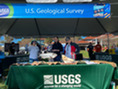
Explore over 140 years of USGS natural science research through lesson plans, activities, maps, podcasts, videos, animations, and more from the USGS Youth and Education in Science (YES) Program. Visit their website for more educational resources for your classroom!
|
|
|
|
|
|