|
🌷 Spring with the USGS Water Science School 🌷
As the days grow longer and spring takes hold, the USGS Water Science School is here to support K–12 teachers with fresh, engaging water‑science resources.
From snowmelt feeding our rivers to the first rains of the season, spring offers countless opportunities to explore the science happening right outside the classroom door. Whether you’re planning upcoming lessons or looking for new ways to connect students with real‑world hydrology, the Water Science School has tools and activities to help bring these concepts to life.
📬 Thank you for being part of our growing educator community, here’s to a season of curiosity, discovery, and flowing learning!
|
|
Spring Into… Springs!
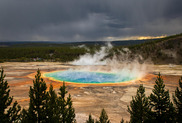
As the world outside thaws, blooms, and springs back to life, it’s the perfect time to explore a different kind of “spring”, one that bubbles up from underground! Learning about springs in spring isn’t just catchy… it’s a great way to connect seasonal change with Earth’s incredible water systems.
A spring is a spot where groundwater finds an opening and flows naturally onto the land’s surface. Sometimes that looks like a tiny trickle that appears only after rain. Other times, it’s a steady, powerful flow that can release millions of gallons a day. Springs form when an aquifer becomes so full that water spills out, often emerging along hillsides, valleys, or rock layers.
Springs come in all kinds of varieties, from cool, crystal‑clear seeps to warm or even hot springs heated by deep underground rock. Their water can be clear, tea-colored, mineral-rich, or even warm enough to soak in. Together, these features make springs perfect natural laboratories for helping students explore groundwater, geology, the water cycle, ecosystems, and water quality.
Spring is a season of new beginnings, so why not dive into one of Earth’s most fascinating water resources?
Learn more about springs here!
|
|
|
 Picture This: How USGS Cameras Capture Changing Water 🎥
The U.S. Geological Survey (USGS) now operates more than 1,000 Hydrologic Imagery Visualization and Information System (HIVIS) cameras across the country.
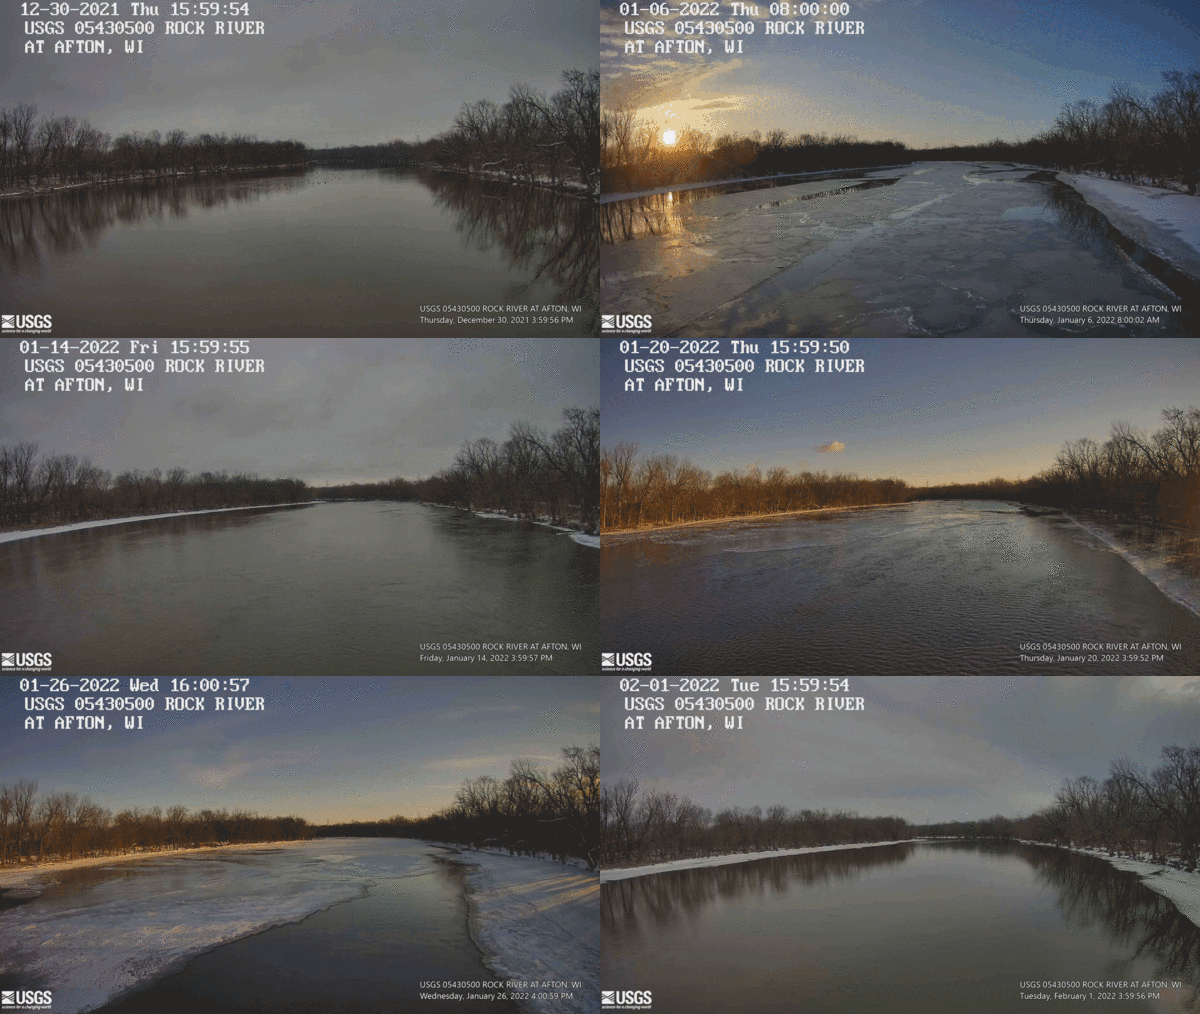
These cameras are installed at streamgages and other hydrologic sites, capturing still‑frame images that show real‑time water and environmental conditions. HIVIS adds powerful visual context to traditional water‑monitoring data, helping scientists, emergency managers, and the public better understand changing water levels, weather impacts, and landscape features over time.
In this activity, students will explore pairs of images from a single HIVIS camera to observe how watersheds change from low‑flow to high‑flow conditions, from winter to spring, or before and after a storm. By comparing real USGS imagery, students practice evidence‑based reasoning and learn how environmental conditions shape the world around them.
Activity: Changing Waters Through Time
Grade Level: 6–8
Time: 15–20 minutes
Students should work in pairs
Objective
Students observe real environmental change by comparing images from a single HIVIS camera at two different times. They identify what changed, what stayed the same, and propose evidence‑based explanations for why the changes occurred.
Navigate to USGS HIVIS Dashboard
Instructions
1. Pick a HIVIS camera site (pairs).
Each pair selects any HIVIS site that interests them. It can be near their community, in a different state, or one with noticeable landscape features (bridges, banks, vegetation, snow, rocks, etc.).
2. Choose two time periods.
Students select:
- One “before” image (e.g., dry weather, low flow, winter)
- One “after” image (e.g., after rain, snowmelt, seasonal change, high flow)
3. Compare & contrast (5 minutes).
Pairs examine both images and record:
- Water level differences
- Changes in water clarity or color
- Vegetation or debris differences
- Weather clues (snow, shadows, cloudiness)
- Human activity differences (bridge conditions, road surfaces, etc.)
4. Explain what’s happening (5 minutes).
Each pair answers:
- What changed between the two images?
- What might have caused the change?
- What evidence supports your reasoning?
5. Quick share‑out.
Pairs present a 20–30 second summary of the biggest change they observed and their explanation.
|
|
|


Empowering the next generation of scientists
In this newsletter we hear from Zach Johnson, a USGS Research Hydrologist for the Washington Water Science Center.
On May 13, I visited the Venture Academy of Leadership and Entrepreneurship (VALE) in Parker, Colorado, an innovative high school dedicated to problem-based learning and workforce readiness.
In the freshman Global Geography lab, students were gearing up to pitch a first draft of prototypes aimed at solving critical environmental challenges. Invited by facilitators Kendra Ackerman and Matthew Collom to provide an industry perspective, I evaluated the feasibility of the students' projects regarding disaster education, wildfire alert systems, and automated water sampling for coastal ecosystems. Based on the feedback, the students will refine their prototypes and approach. I also shared insights into how the USGS tackles these same environmental challenges using real-world systems, bridging the gap between classroom concepts and federal science. I was impressed with the level of creativity and thought toward problem solving from these students and enjoyed hearing about their ideas and sharing some of my perspective as a federal scientist.
|
|
|

The USGS’s Virtual Classroom Visits (VcV) program connects our scientists with classrooms across the Nation, through virtual meeting technology. VcV allows USGS scientists to pop in to schools that are not just around the corner.
Sign up now!
|
|
|
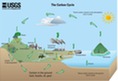
USGS is currently working to create a new Carbon Cycle Diagram. If you are interested in serving as an educator reviewer, please email us at water-science-school@usgs.gov if you'd be willing to share an hour of your time to help us.
|
|
|
|
|
|