|
🍁 Welcome in Autumn with the USGS Water Science School! 🍁
School has started and the USGS Water Science School is ready to support K-12 teachers.
As the seasons shift and leaves begin to fall, it’s a great time to connect your students with the science happening all around them. Whether you're planning next semester’s lessons or just exploring new ideas, the USGS Water Science School offers a wide range of resources to support your teaching.
📬 Thanks for being part of our growing educator community, let’s keep the momentum flowing this fall!
|
|
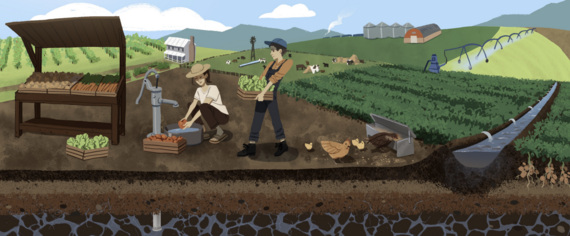 Water plays a vital role in our daily lives and shapes how we interact with the environment. The Water Science School offers educational posters that highlight water use, how water moves, and different ways that water is used both naturally and through human interaction across different settings.
⬇️ Explore water in your environment and download a "Where is the Water?" poster today!
|
|
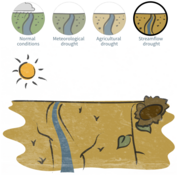
Drought isn’t just about dry landscapes, it can lead to a significant drop in streamflow. This can cause disruptions to ecosystems, agriculture, and the water supplies that communities rely on.
For educators, this presents a powerful opportunity to connect real-world environmental challenges with classroom learning.
The USGS plays a critical role in monitoring these changes. Through its nationwide network of streamgages, the USGS collects continuous, real-time data on river and stream conditions. This data is essential for identifying and understanding streamflow drought, when rivers and streams flow at unusually low levels for extended periods.
Students and educators can learn about streamflow drought through interactive data stories by the USGS VizLab.
🔎 Explore the Science
-
What Is Streamflow Drought? - Discover how USGS streamgage data helps scientists detect drought conditions in rivers and streams. By comparing current streamflow levels to historical trends, we can identify when water levels are unusually low
-
Five droughts that changed history - Explore an annotated timeline of major streamflow drought events across the U.S. It combines data with quotes and anecdotes about the biggest drought events recorded by the USGS.
🧪 Classroom Connection: Try This Streamflow & Drought Activity
Wondering how to bring this data into your classroom? Try this hands-on activity from the Water Science School that helps students investigate how drought affects streamflow and water availability.
📘 Explore the activity: Understanding Streamflow Drought: Impacts on Water, Land, and Communities
|
|
|
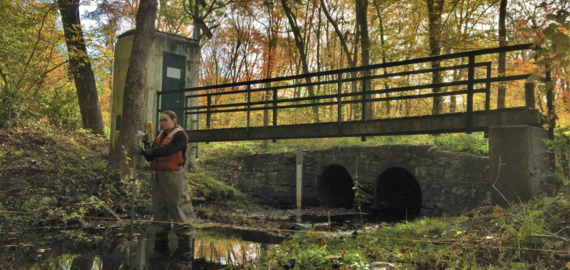 🍂 Fall into Clean Water: How Leaf Collection Helps Protect Our Streams
As autumn paints our neighborhoods in brilliant reds and golds, it also can bring a surprising water quality challenge: fallen leaves. When leaves pile up along curbs and go uncollected, rainwater can wash them into storm drains, releasing nutrients like phosphorus into nearby streams and lakes. This can fuel harmful algal blooms and degrade aquatic ecosystems.
A study by the USGS and partners in Madison, Wisconsin, shows that timely leaf collection and street cleaning can reduce phosphorus runoff by up to 80% in some neighborhoods.
What Educators Can Do:
-
Connect the classroom to the community: Encourage students to observe how their neighborhoods manage fall leaves.
-
Incorporate citizen science: Have students track leaf litter and storm drain locations, or even organize a leaf cleanup day.
-
Explore the science: Use this topic to teach about nutrient cycles, urban runoff, and the role of local actions in protecting water quality.
Learn more: Using leaf collection and street cleaning to reduce nutrients in urban stormwater
Activity: Leaf Litter and Water Clarity Experiment
Grade Level: 4–8
Time: 20 - 30 minutes
Objective: Students will investigate how decomposing leaves affect water clarity and discuss the impact on water quality in urban environments.
Materials (per group of 3–4 students):
- 3 clear plastic containers or jars (labeled A, B, and C)
- Tap water
- Leaf litter (dried leaves from outside)
- Spoon or stir stick
- Notebook or worksheet for observations
Setup:
-
Container A: Fill with water only (control).
-
Container B: Add a small handful of crushed leaves to the water.
-
Container C: Add a large handful of crushed leaves to the water.
Stir containers gently every 10 minutes. Have students observe after 30 mintues and make the following observations. Revisit the containers the next day and make the same observations.
Observation & Discussion:
Have students observe and record:
- Water color and clarity
- Smell (if any)
- Presence of floating or sinking particles
Discussion Questions:
- What differences do you notice between the containers?
- How do the changes you observed in the water with leaf litter help us understand what might happen in real streams or storm drains during the fall?
- Why is it important to manage leaves in urban areas?
Extension Activity: How Fast Does It Drain?
Objective: Students will explore how leaf litter affects the drainage rate of water, simulating how storm drains might become clogged or slowed by organic debris.
Materials (per group):
- The same 3 containers from the leaf litter activity (A: no leaves, B: some leaves, C: lots of leaves)
- 3 plastic cups with small holes poked in the bottom (or funnels with coffee filters)
- Stopwatch or timer
- Measuring cup or graduated cylinder
- Tray or bin to catch draining water
- Notebook or worksheet for recording times
Instructions:
- Place each cup over a tray or bin to catch the water.
- Poke a hole in bottom of cup. (1 cup at a time)
- Start the timer as soon as hole is finished.
- Stop the timer when the water finishes draining.
- Record the drainage time for each cup.
Discussion Questions:
- Which cup drained the fastest? The slowest?
- How did the amount of leaf litter affect the drainage?
- What might this tell us about how storm drains work in the fall?
- How could this impact water flow in neighborhoods or cities?
|
|
|

In this newsletter we hear from educator Samantha Willsey.
I am a science educator with more than 16 years of teaching and program leadership experience. My career has spanned secondary school classrooms in 5 different countries, international experiential education, and national fellowships, including serving as a Fulbright Teachers for Global Classrooms Fellow and an Albert Einstein Distinguished Educator Fellow at the U.S. Geological Survey. In every role, I have worked to connect students with the interdisciplinary nature of geoscience. My goal is always to help students see themselves as agents of change who can apply their learning to both local and global challenges.
Currently, in my 8th grade science classroom in Bremen, Indiana, we are studying kinetic molecular theory. During these lessons, students engage with the USGS water cycle diagram to connect molecular chemistry with environmental processes. Students annotate the diagram by marking fluxes like evaporation, condensation, evapotranspiration, and snowmelt to show precisely where water molecules are absorbing or releasing kinetic energy and where thermal energy increases or decreases. For example, as solar radiation heats liquid water at the ocean surface, molecules gain both kinetic and thermal energy and undergo a phase change into vapor. In contrast, condensation corresponds to a molecular decrease in thermal and kinetic energy. Students can also note that phase changes require or release latent heat, so even when temperature seems constant, energy is being absorbed or emitted in the molecular structure. Lessons like annotating the USGS water cycle diagram to trace molecular energy changes serve as a stepping-stone in helping students understand how energy is stored and transferred in molecular bonds later in a deeper study of climate change and the role of energy in driving Earth’s systems.
- Samantha Willsey
Visit here to learn more about Samantha's innovative approach to science education and her time spent as a Distinguished Educator Fellow at USGS.
|
|
|

The USGS’s Virtual Classroom Visits (VcV) program connects our scientists with classrooms across the Nation, through virtual meeting technology. VcV allows USGS scientists to pop in to schools that are not just around the corner.
Sign up now!
|
|
|
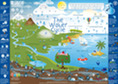
The interactive water cycle diagram is being updated. We are looking to talk to educators to understand how we can improve the diagram. Please email us at water-science-school@usgs.gov if you'd be willing to share an hour of your time to help us.
|
|
|
|
|
|