What’s New In The Flow Photo Explorer?
Simplified Interface – There is now a single page that displays an individual sites’ information alongside a table and map of all sites. This should result in fewer clicks when navigating between sites!
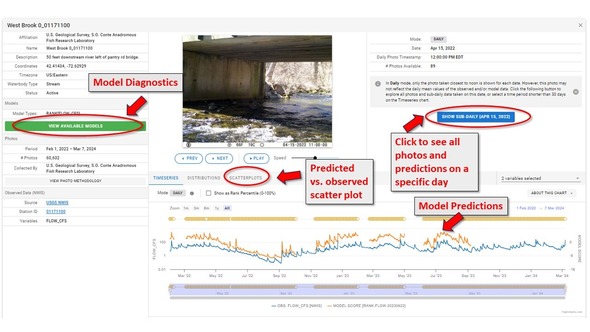
Displaying Model Output – We have trained models to predict a relative measure of streamflow (called a “score”) at several USGS sites using human annotations. You can now view the model predictions within the interactive explorer charts, see model diagnostics, and download diagnostic reports containing figures and metrics describing model performance (click the View Available Models button to access the diagnostic reports).
Approximately 15 sites currently display model predictions and diagnostics, and more will be added in the future. These sites can be found in orange on the site map, or by using filtering the sites table. For example, explore West Brook 0_01171100.
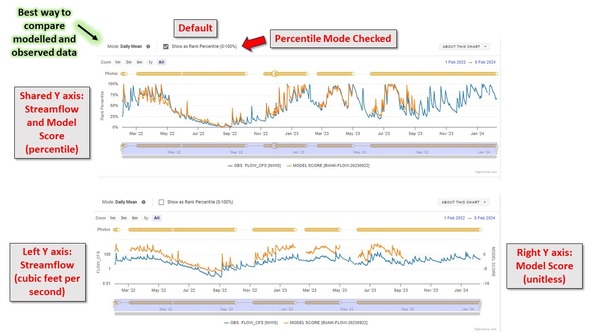
 By default, model results (when available) are shown as relative percent predictions. We think this is the best way to directly compare modeled and observed results. The model results and streamflow can also be viewed in their original units by unchecking the “Show as Rank Percentile” button.
 Upgraded interactive plots – Timeseries graphs have been upgraded for all sites and now display multiple datasets (e.g. stage and discharge, if available).
New scatter plot – In addition to the timeseries and distribution charts, we have added an interactive scatter plot for comparing two variables (e.g., observed flow vs. model prediction).
Integrated time filtering – The time selection window below the time series chart is now linked to the distribution, and scatter charts so only data during the selected period will be shown on all three charts. If in “daily” mode, daily mean streamflow and model predictions are shown; the corresponding image is the closest image to noon. However, if zoomed in to within 30 days, the plot enters “sub-daily” mode and streamflow, model predictions, and images are shown with their sub-daily timestamps.
Capacity to model non-streamflow applications – Long-term, we expect to expand this platform beyond just streamflow (e.g. algae, ice cover, snow depth, turbidity, etc.). The architecture is largely in place now to support these future expansions.
What’s Planned
GIF Downloads – The ability to easily download GIFs (mini videos showing a series of images) to show storm events and allow users to easily display how imagery links with other monitoring data (great for presentations and to share with cooperators).
Annotation Interface Upgrade – We plan to extend the annotation interface to be able to support paired comparisons of more than just streamflow.
Integration with USGS National Imagery Management System (NIMS) database – For sites with suitable camera placement, we plan to be able to view and model streamflow with imagery from the USGS NIMS database. The NIMS database already ingests cell-enabled camera imagery, making it an attractive imagery source. However, not all sites are suitable for our modelling approach and access to NIMS is limited to USGS contributors. View images from the database here.
A publication describing relative flow prediction model performance – We are currently running experiments to refine model performance and better define the period of record and number of annotations needed to run a model with acceptable performance. We will be reporting our findings in a journal article, which will then support future guidance refinements to our users (that’s you!).
Realtime imagery via Cell-enabled trail cameras – We plan to allow users to set up their cell-enabled trail cameras to send images directly to Flow Photo Explorer, resulting in fewer trips!
Field computing device and satellite transmission – We have an experimental effort underway to predict relative streamflow in the field from the imagery (edge computing), and then send the prediction to Flow Photo Explorer via satellite network to support remote applications. For this effort we are partnering with the USGS Hydrologic Applied Innovations Lab.
Frequently Asked Questions
How can I be involved?
Uploading imagery and performing annotations is the best way to contribute!
The annotation interface is only accessible to a select group of users for initial testing and development. To gain access, please contact us at ecosheds@usgs.gov.
Does the model predict volumetric streamflow?
The model predicts a relative measure of streamflow that we call the model score, which is correlated with streamflow. Using these scores, we can sort the images from lowest to highest score, which also sorts them from lowest to highest predicted flow. To compare the predicted scores against observed flows, we can compute the rank percentiles of each, which is the rank of each image based on its score (or flow), and then divide by the number of images to scale from 0 to 100%. We are actively working on a methodology for converting predicted model scores directly to volumetric streamflow, but for now, the rank percentiles are the best way to compare predicted model scores directly to observed flows.
Can I have a model built for my site to estimate streamflow?
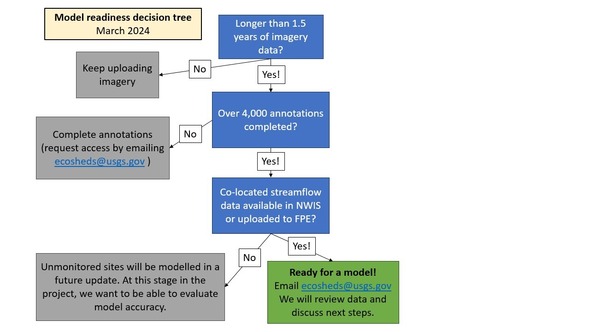
We are able to create models for sites with sufficient data. While an intended use of this workflow is to estimate streamflow using imagery alone, for now we want to report performance for sites with known streamflow data. We think 1.5 years is a good minimum duration before a model can be trained, but we are evaluating this. We also think 4,000 annotations is a good minimum, but we will update the guidelines as we have more information.
Here’s a handy decision tree to determine if a site is ready for a model.
|