|
|
View this newsletter in your browser: https://content.govdelivery.com/accounts/USDOIGS/bulletins/35ae6d9
Spring 🌼 2023
|
|
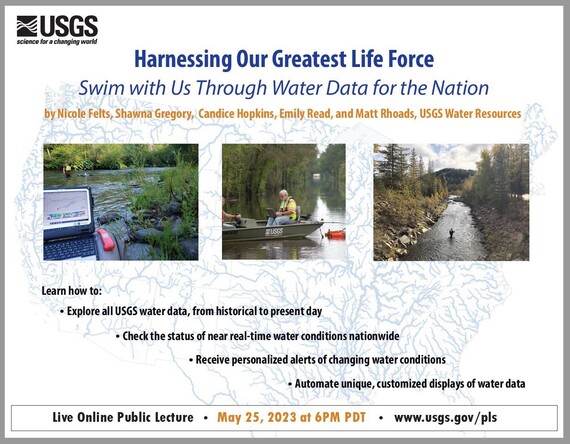 Mark your calendars to join us live on Thursday May 25th at 6 pm PT / 9 pm ET for a USGS Public Lecture on using our modernized systems to access water data.
Learn how to harness our greatest life force, water, by exploring all USGS water data.
|
|
|
View data for multiple locations at once
|
|
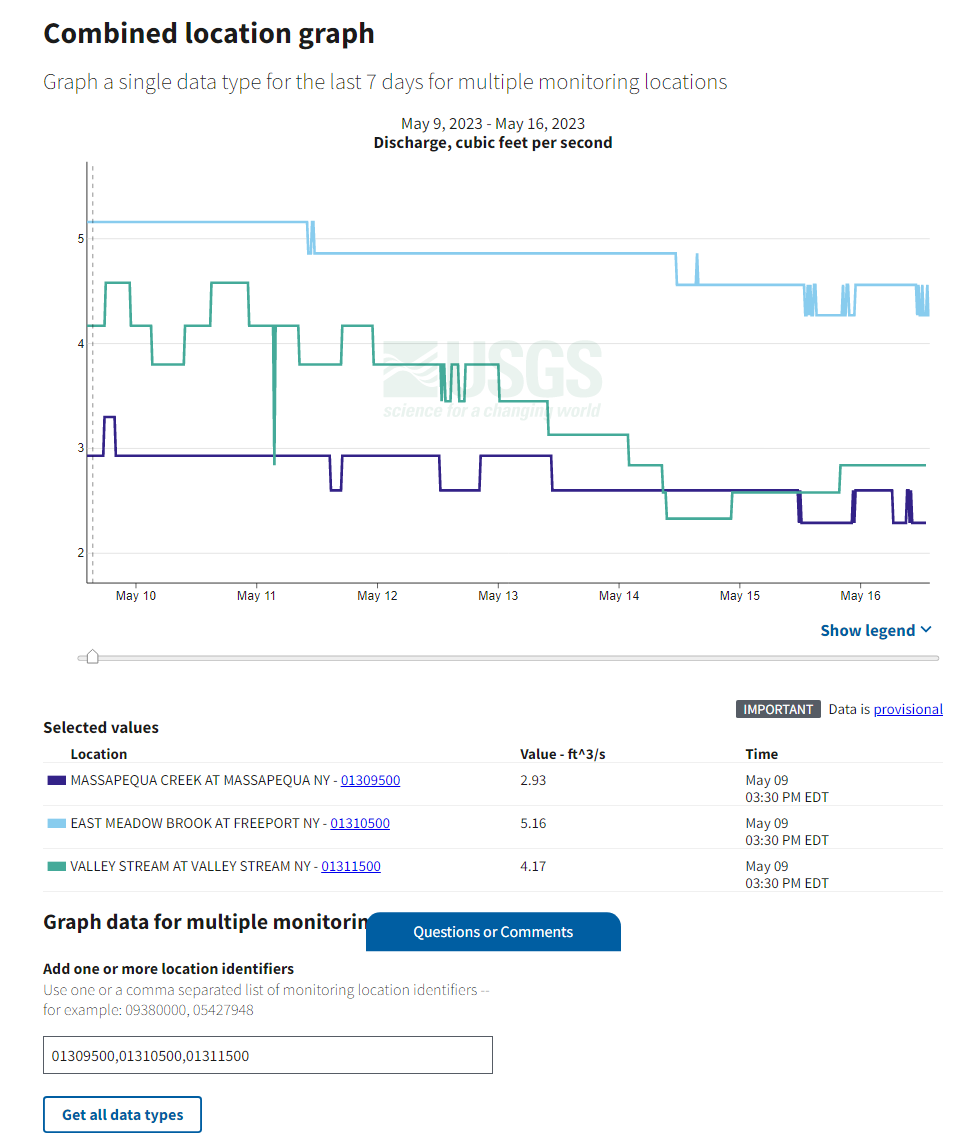 A long-awaited feature of monitoring location pages is COMING SOON! Users will be able to view the latest seven days of data from up to five monitoring locations at once.
|
|
Announcing the Greatest Gage of 2023
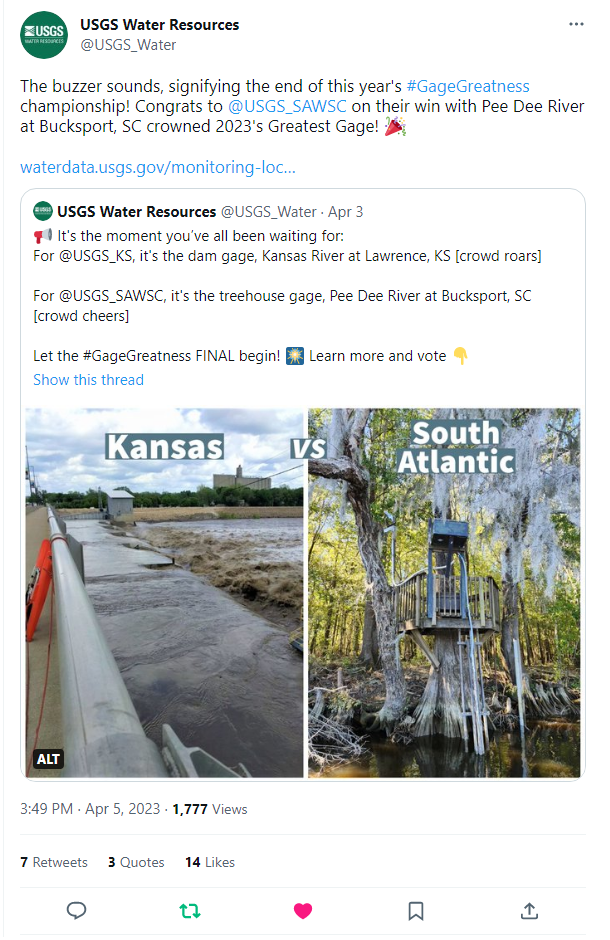 From March through early April, we hosted a fun, EnGaging 😉 public competition on Twitter to choose the greatest gage of 2023 which was Pee Dee River at Bucksport, NC – otherwise known as the Treehouse Gage.
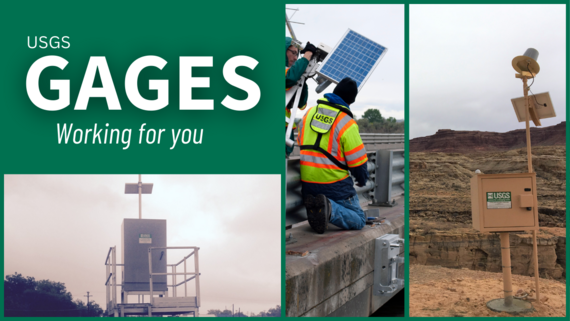 To celebrate the importance of gage data, we created this video about how gages serve us all across the nation.
|
|
|
Water Data for the Nation in 2023
|
|
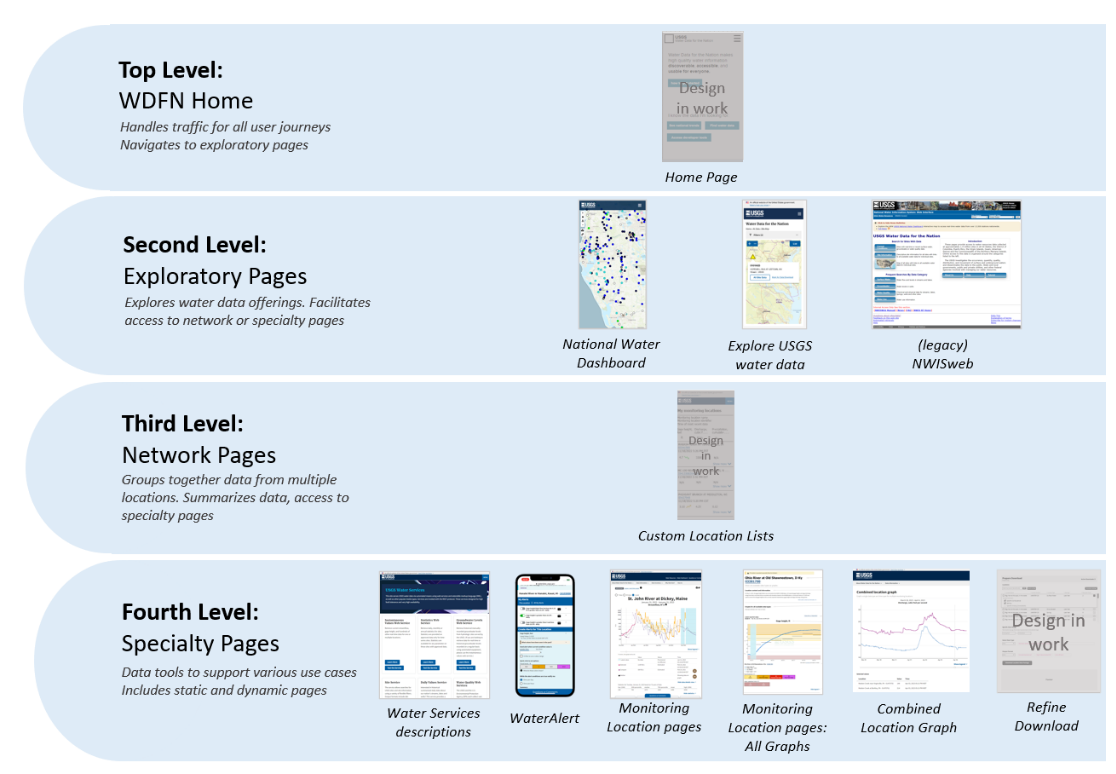 Based on user feedback, we’ll be releasing new capabilities within Water Data for the Nation throughout the year. WDFN Home will be the foyer of our water data house – a simple interface will help users navigate to exploratory pages that best meet their needs.
|
|
New Water Cycle Diagram & More
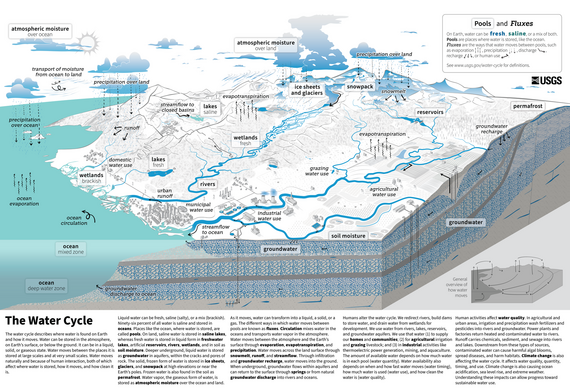
Try out the new resources
Since we revealed the new Water Cycle Diagram in October 2022, we’ve released additional resources that help people interpret and use the diagram. We now have key resources in both English and Spanish!
Educator webinar recording
The webinar described the basis and importance of the new diagram for educators, as well as information about the science it depicts for educators to incorporate into their lessons. Watch the recording or share it with your educator friends!
Giveaways at the NSTA conference in Atlanta
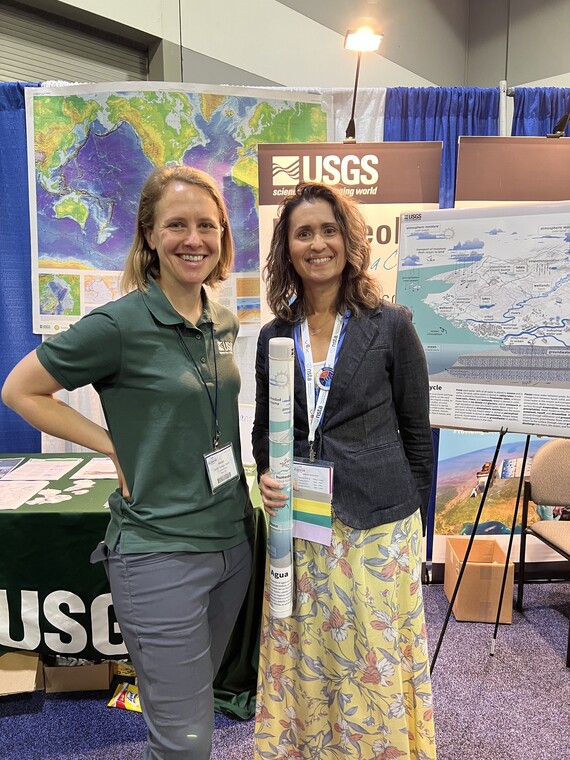 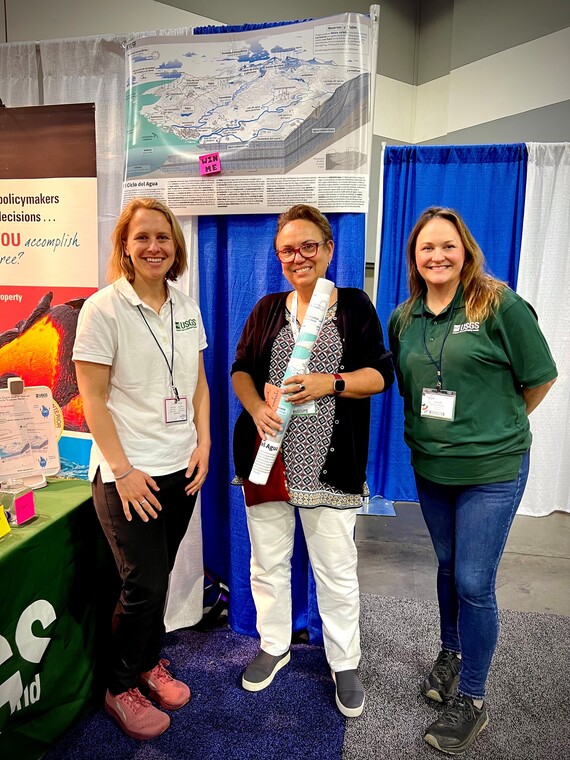 In March we attended the National Science Teachers’ Association conference in Atlanta, Georgia. Educators from all over chatted with us about how they use the Water Cycle Diagram and other Water Science School materials in their classrooms. We gave away multiple posters of the WCD in both English and Spanish.
|
|
Chart Challenge 2023
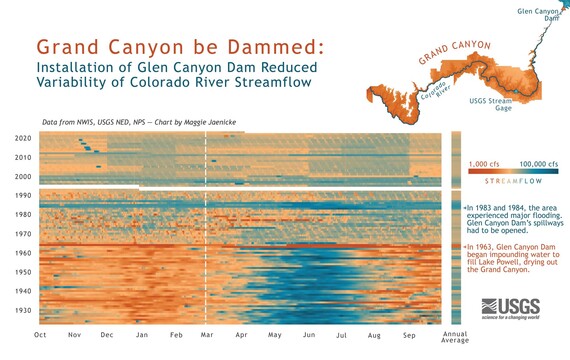
The end of April concludes the end of the 30-day chart challenge of 2023! Our Data Science team participated in posting one or more data visualizations nearly every day of the 30-day challenge.
Which chart do you find most interesting? Follow our Data Science account on Twitter!
|
|
USGS in the news
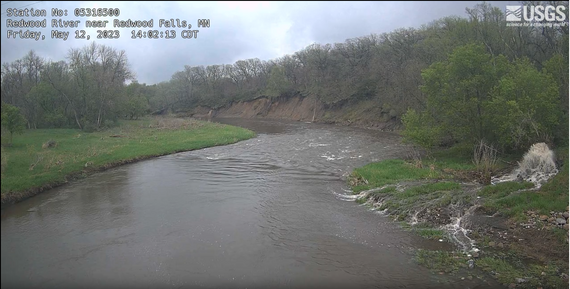 footage from some Minnesota streamgages caught the attention of local news outlets when snowmelt spurred some rapid streamflow changes. USGS Upper Midwest Water Science Center scientists spoke to news staff about the importance and relevancy of USGS science. The USGS Hydrologic Imagery Visualization and Information System (HIVIS) includes imagery from
and find a camera near you.
|
|
Did someone share this newsletter with you?
Join Water Data for the Nation and subscribe to our newsletter today!
Stay up to date with the latest modernization updates by following us on social media
|
|
|
|