
USDA’s Top 100 Ag Co-ops for 2024
Top 100 agricultural cooperatives have solid results in 2024, even with drops in revenues, income, and assets
This bulletin reports on select summary statistics from USDA’s annual survey of the nation’s agricultural cooperatives for their fiscal year 2024.
January 21, 2026
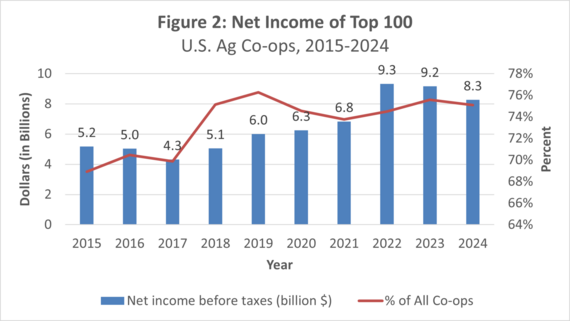
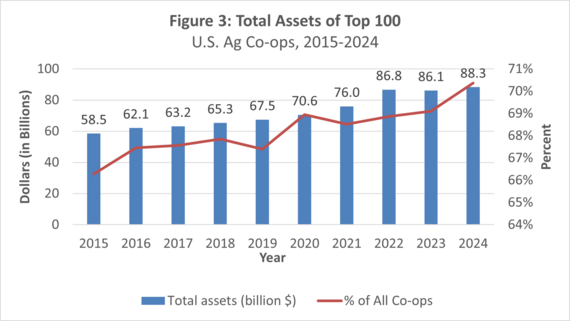
The business volume of the nation’s Top 100 agricultural cooperatives (i.e., the 100 largest in terms of business volume) was $209.1 billion in 2024, a decrease of $14.5 billion, or 6.8 percent, from the $223.6 billion in 2023. These top co-ops also reported a decline in net income of 13.9 percent in 2024, for a total of $8.3 billion (before taxes) that year (Figures 1 and 2). Total assets, however, increased 2.6 percent, from $86.1 billion in 2023 to $88.3 billion in 2024 (Figure 3).
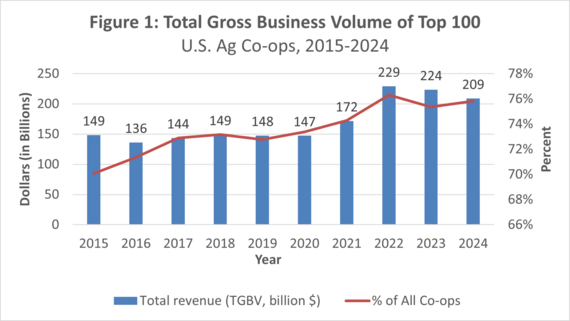 Even though the Top 100 co-ops experienced a drop in revenues, they still experienced favorable headwinds such as declining costs of goods sold in 2024. Total expenses increased, however, entirely due to a share increase in other expenses, which includes things like storage, drying, and crop spraying. Patronage received from other cooperatives declined, as did non-operating revenues
In 2024, total gross sales (sales from marketing commodities and selling supplies) dropped similarly to total gross business volume, from $219 billion to $205.2 billion. Revenues from marketing commodities decreased by $3.6 billion to $138.4 billion, while supply sales fell by $10.1 billion to $66.8 billion for the Top 100 ag co-ops.
For expenses, wages, depreciation and interest all declined. Despite this, other expenses increased sharply, resulting in a 13.9 percent overall increase in total expenses in 2024, or $2.8 billion.
The Top 100 ag co-ops had 76.5 percent of the total gross business revenues of all ag co-ops in 2024. Total gross business revenues are comprised of gross sales, services and other operating revenues, patronage from other cooperatives, and non-operating income. Net income after taxes ($8.1 billion) of the Top 100 was 75.1 percent of all ag co-ops.
 The $88.3 billion in total assets of the Top 100 ag co-ops in 2024 was an increase of 2.6 percent from 2023. Fixed assets increased by 7.6 percent to $26.7 billion in 2024, and investments in other cooperatives also increased, by 14.8 percent, to $3.1 billion.
Total liabilities of the Top 100 ag co-ops increased slightly by 1.6 percent to $48.4 billion in 2024 (long-term liabilities increased by $600 million, or up by 3.9 percent). Member equity was up at a record $40 billion, of which 55.7 percent ($22.3 billion) was equity allocated to members.
Total assets of the Top 100 were 70.4 percent of the total assets of all ag co-ops, while member equity was 66.6 percent of all co-op equity.
 Profile of the Top 100
The 100 largest ag co-ops reported serving 642,108 members and employing 111,272 people in full- and part-time positions. Compared to the entire population of the Nation’s ag co-ops, the largest 100 co-ops (6 percent of the total 1,620 ag co-ops) served 37.0 percent of all co-op members and employed 66.4 percent of the people.
Top 100 co-ops operated 4,005 locations (43.3 percent of all co-op locations) in communities across the United States. Thirty-five Top 100 ag co-ops have been operating for more than 100 years, 26 co-ops for 75 to 99 years, 18 co-ops for 50 to 74 years, and 21 for less than 50 years. The average size of the board of directors of Top 100 ag co-ops was 13, while the average size of boards of all ag co-ops was eight.
Over one-third of the Top 100 ag co-ops (35 of them) were grain and oilseed co-ops. There were 18 co-ops in the Top 100 that marketed milk and milk products (dairy), 24 were in the farm supply business. Six marketed fruits and/or vegetables, and seven marketed sugar. Four were livestock, and six co-ops were in the other category (commodities including rice, poultry, and nuts).
Iowa, Minnesota, and California had highest Top 100 ag co-op sales
Seventy of the 100 largest ag co-ops operate in more than one State, 70 of those operate in more than two States, and 36 of them operate in more than three States. The other 30 co-ops operate within just one State.
- Iowa had 37 Top 100 ag co-ops operating within its borders which conducted $26.4 billion in net sales, a combination of $17.8 billion in commodities marketed and $8.6 billion in supply sales.
- Minnesota had $16.6 billion in net sales conducted by 33 Top 100 ag co-ops.
- California had 12 co-ops with $12.8 billion in net sales.
- Illinois ($11.3 billion) and Nebraska ($10.0 billion) also topped $10 billion in sales, by 24 and 18 Top 100 co-ops, respectively.
When breaking out commodities marketed, Iowa had the most marketing net sales of the Top 100 ag co-ops at $16.1 billion, and California and Minnesota followed with $12.5 billion and $13.5 billion, respectively. For supplies, the Top 100 ag co-ops had the most net sales in Iowa at $6 billion, followed by Nebraska with $3.2 billion and Minnesota with $3.1 billion.
For 2024, net sales of the 100 largest ag co-ops was at $178.8 billion, with $134.5 billion coming from marketing commodities and $44.3 billion coming from supply sales in 2024. These co-ops also conducted $26.7 billion in business between themselves, and when added to net sales, resulted in the total $205.2 billion in gross marketing and supply sales.
Tracking the Top 100
Tracking the Top 100 co-ops’ performance year-to-year provides insight into trends and economic forces impacting ag co-ops and their member owners. The various financial ratios discussed may also serve as a yardstick that all co-ops can compare their own status to.
Strong financial performance allows co-ops to invest in additional or renewed operational assets; use funds to shore up their financial foundation and to pay out patronage refunds and revolve member equity to members. The operations of the nation’s 100 largest agricultural cooperatives represent a wide diversity of agricultural businesses. As such, it is difficult to point to two or three reasons for the ranking changes that occurred within the list in the past year. While there are several reasons that a co-op’s rank, total business volume, revenue, expenses, and income may change on a year-to-year basis; these factors vary depending upon the sector the cooperative operates within. Total business revenue changes of a co-op can be influenced by:
- Cooperative-sector structural changes, such as mergers and dissolutions and/or co-op participation in LLCs, joint ventures, and partnerships,
- Prices and supply and demand conditions (for some commodities and supply inputs there were increases, for others decreases),
- Energy-sector performance, food-price fluctuations, trade circumstances,
- Crop, land, and weather conditions; etc.
It remains important to keep these and other factors in mind when assessing the rank and performance of the Top 100 U.S. agricultural co-ops.
While this analysis focused on the Top 100 ag co-ops, it does not diminish the importance of small- to mid-sized ag co-ops and their significant contributions to agriculture and the food and fiber system. All co-ops operate to effectively serve members, striving to provide them with excellent services and greater economic benefits than they would otherwise experience without their direct participation and ownership in their cooperatives. Together, ag co-ops of all sizes and types play a critical role in the agricultural economy of the United States and together, they all positively impact rural and urban communities, the labor market, and farmers and consumers throughout the Nation.
Full 2024 Top 100 Ag Co-ops Bulletin Complete with Tables is Available
This bulletin was developed from the information contained in a more comprehensive report that is available in .pdf format. The full report contains the same charts shown here, but also 7 tables. To learn more, read the full 2024 Top 100 Ag Co-op Report or email your request to coopinfo@usda.gov.
Bulletin Link: https://content.govdelivery.com/accounts/USDARD/bulletins/4033db4

|
Signup for USDA emails and updates GovDelivery (select cooperative development topic areas)
|
USDA Rural Development
Cooperative Services Branch
Interagency Working Group for Cooperative Development
|
