
Agricultural Cooperatives experience strong results despite a slight drop in business volume for 2024
This bulletin provides a brief summary of cooperative statistics from USDA’s annual survey of the Nation’s agricultural cooperatives for fiscal year 2024.
January 20, 2026
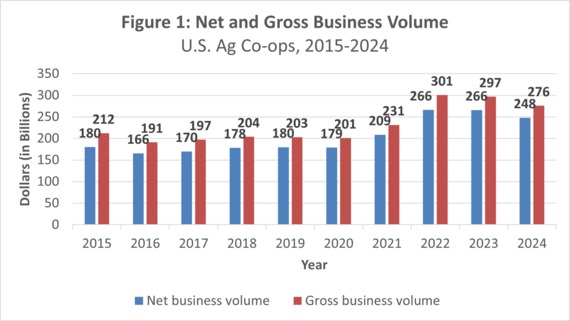
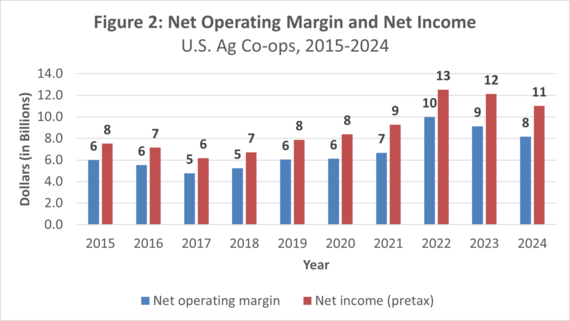
USDA’s annual survey of the nation’s 1,620 farmer, rancher, and fishery cooperatives shows that cooperative revenues remain near record levels, at $275.8 billion in 2024, although they have declined slightly from the all-time high seen in 2022. Net income before taxes in 2024 was $11 billion, about a ten percent decrease compared to 2023 (Figures 1 and 2).
- Marketing sales by co-ops dropped 4.5 percent from 2023 to $174.4 billion.
- supply sales fell by 11.5 percent to $93.9 billion (compared to $106.1 billion in the prior year).
- Service receipts and other operating income dropped by six percent to $4.7 billion.
- Gross operating revenue dropped by 7.1 percent to $272.9 billion.
- Total expenses increased by 11 percent from $27.0 billion in 2023, to $30.0 billion in 2024.
- Wage expenses declined slightly, as did interest, by 0.7 percent and 4.2 percent, respectively.
- Patronage received from other cooperatives increased slightly, by $30 million to $1.23 billion, while non-operating income declined by almost ten percent, from $1.8 billion in 2023 to $1.6 billion in 2024.
- These factors together resulted in a 9.1 percent drop in net income before taxes to about $11.0 billion. Net income is particularly important as it allows co-ops to return earnings to members as patronage and equity redemption, strengthen balance sheets, or invest in operational assets that improve services to members. Return on assets declined slightly in 2024, while return on allocated equity fell by 4.2 percentage points.
- Total gross business volume – the aggregation of sales, service receipts and other operating revenue, patronage received, and non-operating income – was $20.9 billion lower than 2023, at $275.8 billion in 2024.
- Net business volume (excluding the $27.7 billion of sales between cooperatives themselves) was $248.0 billion, down $17.8 billion from 2023.
  Balance sheets remain strong
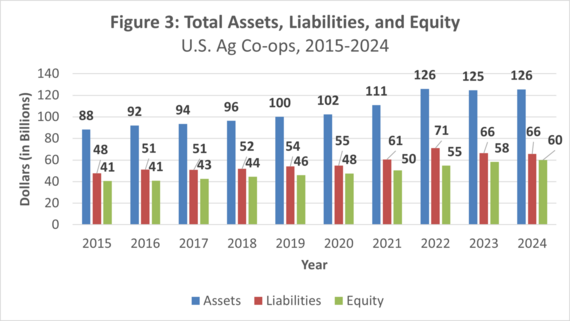
The combined balance sheet for the Nation’s ag co-ops remained strong, with total assets of $125.6 billion ending up close to the 2022 years record of $126.0 billion. Member equity exceeded the record set in 2023, increasing $1.8 to a total of $60 billion in 2024 (Figure 3).
- Assets grew just 0.7 percent, to a total of $125.6 billion. Investments in property, plant, and equipment (fixed assets) by ag co-ops – including grain elevators, warehouses, farm supply stores, petroleum/convenience stores, fertilizer, and feed plants, major food and beverage processing plants, etc. – increased, to a record $38.2 billion, up $2 billion in 2024.
- Total liabilities continued to decline in 2024, from $66.5 billion in 2023, to $65.5 billion in 2024.
- Allocated equity and retained earnings increased in 2024, reaching $30.8 billion and $29.2 billion, respectively.
- For 2024, the balance sheet ratio of debt-to-assets dropped 52.2 percent, but equity to assets increased to 47.8 percent.
 Sales category changes
Net business revenue in 2024 increased in the commodity sectors of beans and dry peas, dairy, fish, livestock, nuts, poultry, fruit and vegetables, and sugar. The highest marketing increases were in poultry (61.6 percent) and beans and dry peas (up 23.0 percent). By dollar, revenues increased in dairy (up $2.8 billion). Overall, net sales of commodities declined by $8 billion, from $177.8 billion in 2023 to $169.8 billion in 2024.
For supplies, all categories declined in sales in 2024, with petroleum and fertilizer seeing the largest dollar value and percentage declines respectively. Feed sales declined by $1.3 billion to $14.0 billion. Petroleum (i.e., energy products) declined from $25 billion to $21.6 billion. Crop protectant sales declined from $10.2 billion to $9.2 billion and fertilizer sales from $18.7 billion to $15.8 billion. Finally, seed sales declined from $4.5 billion in 2023 to $4.2 billion in 2024. Overall, supply sales were down by $9.3 billion in 2024 compared to 2023.
Cooperative numbers and types
The number of ag co-ops continues to decline. In 2024, USDA counted 1,620 farmer, rancher and fishery co-ops, down from 1,647 in 2023, a drop of 27 co-ops. While there are some co-op dissolutions occurring each year, the major cause for the decline in numbers is the continuing trend of mergers among cooperatives. Co-ops are merging to gain further economies of scale, increased efficiency, greater regional reach, and to better position themselves for future strength and growth.
In 2024, 830 co-ops (51.3 percent) predominantly marketed commodities, and the other 790 consisted of 683 farm supply co-ops and 107 service co-ops (i.e., those that provide storage, transportation, information, or agronomy services, etc.).
For marketing co-ops in 2024, grain and oilseeds were the major commodities of 312 co-ops, cotton and cottonseed of 106 co-ops, fruit and vegetables of 93 co-ops, milk and milk products of 93, livestock and poultry (including eggs) of 59, and fish of 37 co-ops. The other 130 co-ops market wool, dry beans and peas, nuts, rice, tobacco, and various other commodities.
For 2024, 637 co-ops were further categorized as just “marketing” while 193 were labeled as “mixed marketing.” Among farm supply cooperatives, 517 co-ops depended on supplies for 100 percent of their sales (categorized “farm supply”), while 166 co-ops were “mixed farm supply.”
While cooperatives are categorized based on a majority of sales in specific areas, many co-ops have very diverse operations, conducting two or three primary service functions for members. Some co-ops not only market their members’ products – including crops, milk, livestock, fruit/vegetables, poultry and fish – but also conduct value-added processing and brand marketing, sell farm production supplies and/or provide members with a variety of on-farm and operational services.
It is worth noting that while the numbers of ag co-ops have been dropping, those that remain continue to operate 9,260 locations across all 50 States. In addition to headquarters, ag co-ops had 7,640 other locations consisting of separate branch facilities, plants, elevators, c-stores, service centers, and other types of locations in 2024.
Structural characteristics, memberships, employees
Most ag cooperatives are centralized cooperatives – largely local or state-wide co-ops with individual members. Some centralized co-ops operate over multi-state areas and
provide more vertically integrated services, such as further processing products or
manufacturing feed. The number of centralized co-ops dropped by 23 (1.5 percent) from 1,538 to 1,515 from 2023 to 2024.
There were 28 federated ag co-ops and 77 mixed co-ops in 2024, a loss of one and three respectively over the prior year. In a federated cooperative, two or more individual-member cooperatives have organized to jointly market products, purchase supplies, or perform service or bargaining functions. In mixed co-ops, the membership includes other co-op associations as well as direct memberships of individual producers.
- Memberships were reported at 1,735,929, down by 37,380 members from 2023. Not all farmers, ranchers or fishermen belong to a cooperative, but many producers belong to two or more co-ops. For instance, a dairy farmer may market milk through a dairy co-op while buying farm production supplies and services from supply co-ops.
- Ag co-ops reported 189,764 total employees in 2024, 1,779 fewer than in 2023. About 21 percent of those (39,378) were part-time or seasonal employees.
- The average board size for co-ops with sales up to $99.9 million in sales was 7, while co-ops with sales from $100 million up to $1 billion had an average board of 10, co-ops with sales of more than a billion dollars had 15 directors, and overall, average board size was 8.
Top Cooperative activity States
In 2024, the number of ag co-ops with operations in two or more states was 201, while the remaining 1,437 operate within one state. Minnesota had 174 ag co-ops conducting business in the State, followed by Texas with 155, North Dakota with 126, California with 114, Wisconsin with 80, and Illinois with 106.
Iowa was the leading state for co-op net sales volume, at $27.9 billion from 96 co-ops, which includes sales from all co-ops with operations in the State, not just those with headquarters there. Minnesota ranked second with $24.1 billion (174 co-ops), followed by California with $17.7 billion (114 co-ops). The top 20 States by ag co-op total net amounted to 196.6 billion in 2024, or 81.7 percent of all net sales nationally.
Forty-nine States are home to headquarters of at least one ag co-op. Nevada was the only state without a co-op based within it in 2024. Three states are home to the headquarters of 100 or more ag co-ops: Minnesota (136), Texas (131), and North Dakota (105). California previously had 100 co-ops based within the state, but as of the 2024 survey this number has declined to 97.
Co-ops importance in Rural America
Agricultural cooperatives have been a mainstay in rural America for more than a century. USDA’s cooperative database shows that:
- 393 co-ops (22 percent of all ag co-ops) are 100 or more years old.
- Sixty-one percent (1,002 co-ops) are 75 years or older
- 79 percent (1,265 co-ops) are more than 50 years of age
Ag co-ops are an efficient and sound marketing channel for their members’ commodities, many adding value to products, further benefitting member-owners economically. Co-ops also continue to provide supplies and services members need to operate their operations in challenging agricultural and economic environments.
Overall, the data show that ag co-ops are well managed, efficient, and financially solid, helping to provide a strong foundation for the viability of the rural communities in which most producer-members live and where many of the thousands of co-op facilities are located. Ag co-ops also boost the economies of many less-rural cities where co-ops may have offices, plants, or other facilities. Co-ops are investing in their operations, as evidenced by the continuing high level of fixed assets reported in 2024.
A strong benefit for producers marketing and purchasing through their cooperatives is that they get to experience the opportunity to share in the record income through patronage refunds on the business they did with the cooperative, dividends on preferred stock they own, or the retirement of equity they have in the cooperative. The continued strong performance of ag co-ops in 2024 shows that the time-tested, member owned and governed co-op business influence remains as important as ever to America’s producers and to the overall performance of the food and fiber system, which significantly benefits consumers as well.
|
Full 2024 Summary Bulletin is Available with More Charts and Tables
This bulletin is a shortened version of a more comprehensive 2024 Overall Summary Report that contains 8 charts and 4 tables. To learn more, read the USDA Ag Co-op 2024 Overall Summary Report or you may request it at this email: coopinfo@usda.gov
Bulletin Link: https://content.govdelivery.com/accounts/USDARD/bulletins/4033d4c
The Top 100 Ag Co-op summary bulletin for 2024 will be delivered tomorrow, January 21, 2026.
|
|
