Census Bureau News -- Automobile Manufacturing Shipments and Employment Up, According to Census Bureau's Economic Census
Census Bureau News -- Automobile Manufacturing Shipments and Employment Up, According to Census Bureau's Economic Census
FOR IMMEDIATE RELEASE: THURSDAY, AUG.
21, 2014
Automobile Manufacturing Shipments and Employment Up,
According to Census Bureau’s Economic Census
Statistics
Available for Manufacturing of Light Truck and Utility Vehicles and Heavy Duty
Trucks
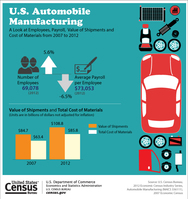
The total value of shipments
for the automobile manufacturing industry (NAICS 336111) was $108.8 billion in 2012, up 28.4 percent from $84.7 billion in
2007, according to the latest 2012 Economic Census statistics released today by
the U.S. Census Bureau. The number of employees increased 5.6 percent, from
65,436 in 2007 to 69,078 in 2012.
While shipments and
employment increased, the number of establishments decreased from 188 in 2007
to 180 in 2012. The average payroll per employee decreased 6.5 percent, from
$78,092 in 2007 to $73,053 in 2012.
Total value of shipments for
the light truck and utility vehicle manufacturing industry (NAICS 336112) decreased 20.7 percent, from $154.0 billion in 2007 to $122.2 billion
in 2012. For this industry, other highlights include:
·The
number of establishments decreased from 90 in 2007 to 77 in 2012.
·The
number of employees decreased 31.3 percent, from 84,806 in 2007 to 58,241 in
2012.
·The
average payroll per employee decreased 3.8 percent, from $81,262 in 2007 to
$78,194 in 2012.
The total value of shipments
for the heavy duty truck manufacturing industry (NAICS 336120) increased 51.9 percent, from $19.4 billion in 2007 to $29.5 billion
in 2012. For this industry, other highlights include:
·The
number of establishments decreased from 101 in 2007 to 82 in 2012.
·The
number of employees increased 3.7 percent, from 29,120 in 2007 to 30,190 in
2012.
·The
average payroll per employee increased 15.3 percent, from $46,498 in 2007 to
$53,630 in 2012.
·Of
the total value of product shipments for this industry, trucks weighing between
14,001 pounds and 33,000 pounds made up 13.0 percent; trucks weighing 33,001 pounds
or more made up 67.5 percent; and buses, including military and firefighting
vehicles, made up 18.2 percent.
The statistics published in
this report represent motor vehicles that were manufactured by establishments
in the U.S. and were shipped domestically or exported. Information on motor
vehicle exports are available from the Census Bureau’s foreign trade data. The statistics
released today represent only the manufacturing of vehicles, not sales. Later
this month, 2012 Economic Census statistics on the nation’s motor vehicle
dealers will be released.
For a definition of the
automobile manufacturing industry, see the North American Industry
Classification System (NAICS) page at (336111). The page also has similar definitions for light truck and utility
vehicle manufacturing (336112) and heavy duty truck manufacturing (336120).
These statistics are
part of the 2012 Economic Census Industry Series, which publishes national figures
for detailed industries, as well as information on the product lines sold by or
services provided by businesses. These data are collected on establishments,
which are typically single physical locations of a business that produce or
distribute goods or perform services and can be accessed via American FactFinder.
Future 2012 Economic Census Industry Series releases will include
first time information on the emerging industries of solar, wind, geothermal
and biomass electric power generation. This series will be released through February
2015; for more information on these future releases, see http://www.census.gov.
About the Economic Census
The
U.S. Census Bureau conducts an economic census every five years and provides a
comprehensive and detailed profile of the U.S. economy, covering millions of
businesses representing more than 1,000 industries and providing unique
portraits of American industries and local communities.
Economic
census statistics will be released over a two-year period, through June 2016.
Statistics at the local level, including information for more than 5,000
communities not available from previous economic censuses, will be available
starting in February 2015. About 40 billion cells of data on U.S. businesses
with paid employees will be released in total. Separate statistics for 2012 on
the approximately 21 million businesses without paid employees are available here.
-X-
The statistics presented in this release
are based on data from the 2007 and 2012 Economic Censuses and include data
only for establishments with paid employees. The 2012 Economic Census Industry
Series results will be superseded in subsequent 2012 Economic Census data
product releases.All dollar values are expressed in current
dollars relative to each survey year; i.e., they are not adjusted for price
changes. For
more information about the Economic Census, including a data release schedule and information on comparability, confidentiality protection, sampling
error, nonsampling error, and definitions, see http://www.census.gov.

