|
November 27, 2020
I hope that you and your loved ones are doing well, staying healthy, and looking out for your neighbors and friends in these difficult times.
I hope you were able to have a safe and happy Thanksgiving yesterday. The holiday threw off COVID reporting to some extent. As occurs on weekends, there was no reporting yesterday of positive test results (the positives included presumed positives), and a number of counties failed to report test results yesterday. So, please consider today’s numbers very tentative. They’ll be fixed as soon as possible. But they’ll likely show more than 1,000 new cases each day.
I also have more information for you today on the new method of test reporting that OHA is beginning to use. And also the summary of the latest COVID weekly report. It sadly again shows record increases in new COVID cases, hospitalizations, and deaths.
Please stay safe, and let me know if you have any questions about today’s newsletter.
TODAY’S CORONAVIRUS AND CORONAVIRUS RESPONSE UPDATE
-
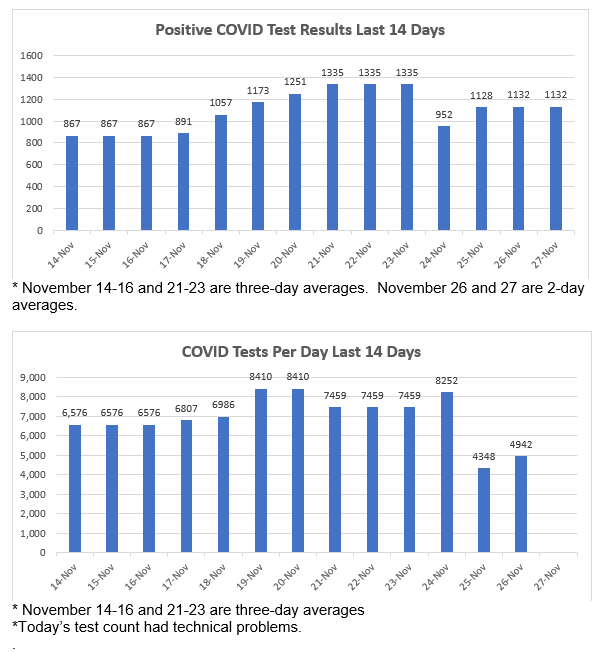
Positive Cases: OHA reports today that 2,263 additional Oregonians have tested positive for COVID-19 since Wednesday, an average of 1,132 per day. The cumulative total for those testing positive since the beginning of the pandemic is 67,515.
-
Total Tests: The number of reported COVID test results has increased by 2,398 since Wednesday, an average of 1,199 per day. OHA reports that a technical problem has kept many negative test results from being reported today, hence the unusually low number of tests reported. The cumulative total of tests since the beginning of the pandemic is presently 1,028,119, but that will be revised once the technical problem is resolved.
-
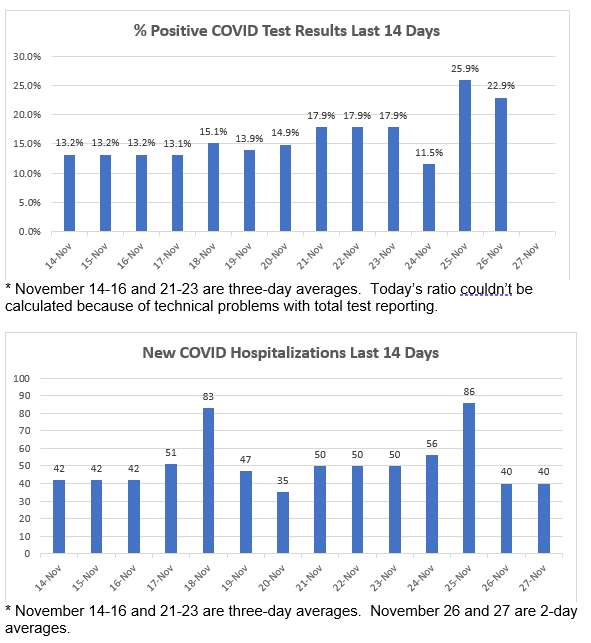
Positivity Rate: The national ratio today is 9.1%. (As a result of the lack of reported negative numbers in Oregon for today, it’s impossible to get a meaningful state positivity rate for today.)
-
Deaths: I’m sorry to have to report 3 additional COVID deaths today (following yesterday’s report of 15). You can read about the Oregonians we lost further down in the newsletter. The total number of COVID deaths in Oregon is now
-
Hospitalized: OHA reports 81 new COVID hospitalizations since Wednesday, an average of 40 per day. The cumulative number of those who have been hospitalized with COVID is now 4,343.
-
Presumptive Cases: OHA is including “presumptive COVID-19 cases” in its daily reports, consistent with recently amended guidance from the Centers for Disease Control and Prevention. A presumptive case is someone who does not yet have a positive PCR test but is showing symptoms and has had close contact with a confirmed case. If they later test positive by PCR, those will be recategorized as confirmed cases. OHA reports 68 new presumed positives today. The total number of presumed positives has been 3,251.
-
Other Hospital Information:
- Patients Currently with COVID-19 Symptoms (who may or may not have received a positive test result yet): 569 (37 more than Wednesday). Of those, 521 have already received a positive test back.
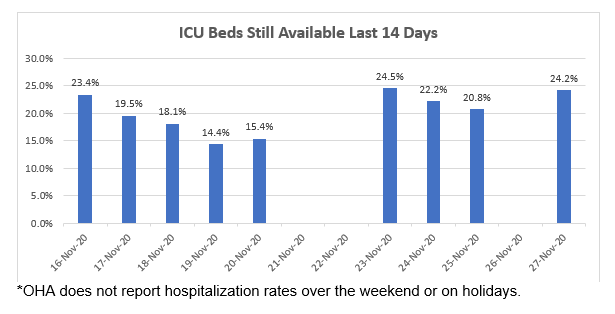
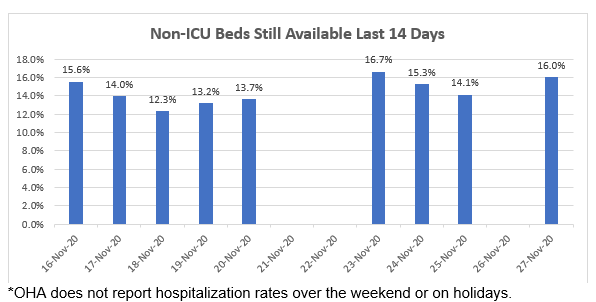
- Available ICU Beds: 170 (24 more than Wednesday).
- Other Available Beds: 708 (78 more than Wednesday).
- ICU Patients w COVID-19 Symptoms: 123 (5 more than Wednesday).
- COVID-19 Patients Currently on Ventilators: 50 (2 more than Wednesday).
- Available Ventilators: 749 (2 fewer than Wednesday).
-
Dashboards:
-
Today’s National Numbers:
-
Additional Brief Updates:
- The Oregonian’s Jamie Hale has an encouraging story from southern Oregon about a young family that is among the first in the Medford area to be able to move into a FEMA-provided temporary mobile home. So far, 325 families from the area have been approved for temporary housing.
The New COVID Test Reporting Methodology at Work
This week’s Weekly COVID Report introduces us to the new method of reporting that OHA is adopting, one that will bring us more in line with the way that tests are reported in other states.
Up to now, OHA has been counting every individual who has received a test in order to calculate the total number of tests given. This is useful in order to know what percentage of our population has had access to testing, but it doesn’t account for multiple tests given to the same people. We have had many health professionals, care workers, and others who have been tested more than once, as well as people who may have had multiple contacts with others who’ve tested positive. This has become increasingly the case over the last two months.
Most other states have been reporting those repeated tests as separate tests, which is one reason that Oregon’s reported numbers have been much lower than most other states.
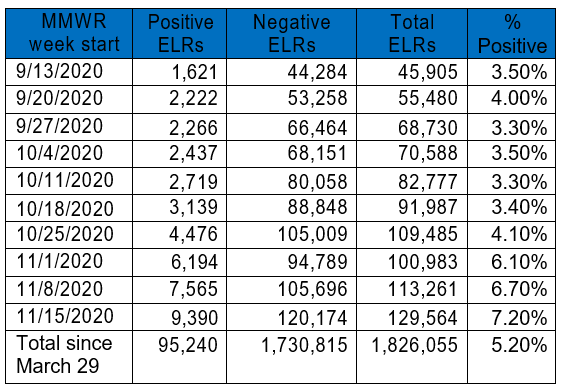
The 129,564 in total tests reported for last week (new method) is nearly 3.5 times higher than the previous week’s 37,651 (old method).
This change obviously also affects our reported positivity rates, i.e., the percentage of total reported tests that are positive. Under the new method of calculating the fraction, the numerator (number of positive tests) remains the same, whereas the denominator (total reported tests) is much larger. As a result, the percentage rate becomes much lower.
OHA has recalculated the reported test numbers, and in this week’s Weekly Report we can see a graph comparing the positivity rates for the two methods since the beginning of the pandemic:
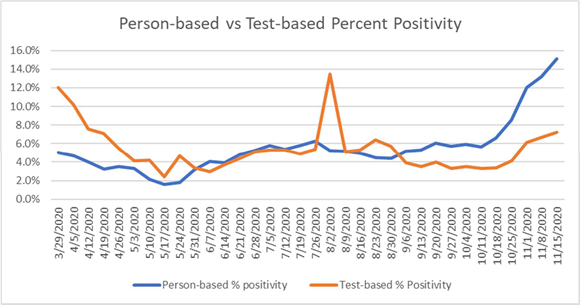
The Weekly Report also gives us a history of testing and positivity rates from the beginning of the pandemic. Here, for example, is an excerpt for the last couple of months:
 Again, one of the benefits of the new methodology is that it allows a more correct comparison with what is going on in other states. The national positivity rate (as reported by the COVID Tracking Project, which uses the total test method) for 11/15-11/21 was 10%. As you can see in the chart, Oregon’s was 7.2%. This is a high rate for Oregon (double what it was a month ago), but still lower than the rest of the country. Under the old method, our positivity rate would have been close to 18%.
The new method is now being used for the regular reports on county metrics, as well as in these weekly reports. It’s not clear yet when it will be reflected in the daily reports and dashboards, but OHA has promised that will come soon.
The weekly report also uses the new method to provide testing and positivity rates for each county. I’ll provide an overview of those findings in tomorrow’s regular County Report for the newsletter.
Latest OHA Weekly COVID Report Released
OHA released its WEEKLY COVID REPORT yesterday. It is again a very comprehensive snapshot of different aspects of transmission of the disease in Oregon over the past week or so. It confirms what we’ve been seeing in our daily reports: we are seeing record rates of transmission in Oregon, , accompanied by low testing rates and increases in test positivity, hospitalizations, and deaths. It continues to show ongoing disproportionality among racial and ethnic groups.
During the week of November 15–21,* 129,564 tests for COVID-19 were performed on Oregonians; of these, 7.2% had a positive result.† This figure represents a change in the way OHA is calculating test positivity. Previously, OHA used a “person-based” method—i.e., OHA reported persons tested, in which those testing positive were excluded from the count for 90 days following their initial test and those testing negative were excluded from the count unless they later tested positive. OHA is now using a “test-based” method, whereby all electronic lab reports received by OHA will be used to calculate percent positivity.
§ This change was prompted by changes in testing patterns. Earlier in the year, relatively few people were being tested multiple times, and their repeated results exerted a significant effect on test positivity; but under current test practices, many people are being tested more than once, so that with the “person-based” method, test results from an increasing proportion of Oregonians were being excluded from the positivity calculation. The new method more accurately reflects the amount of COVID-19 testing in Oregon. Detailed tables of the number of tests and percent positivity can be found in tables 5 and 6. A comparison of the two methods is shown below. * This date range aligns with CDC’s “MMWR week.” † Does not include antibody (serology) tests. § www.cdc.gov/coronavirus/2019-ncov/lab/resources/calculating-percent-positivity.html Oregon Public Health Division Published November 25, 2020 Data are provisional and subject to change. Page 2 of 62 COVID-19 Weekly Report Oregon’s Weekly Surveillance Summary Novel Coronavirus (COVID-19) W

Here are some of OHA’s broad observations of where we are now, based on data from November 16-November 22:
- We see once again a big increase in the number of new cases. Last week OHA reported a new record 8,687 new cases of COVID-19 infection—up 34% from last week’s record tally of 6,491.
- This report includes the new test reporting methodology, which is based on total tests given (rather than total individuals tested), resulting in a higher number of tests. This is now using the same national methodology that I’ve been providing in my daily national reporting (from the COVID Tracking Project), which creates a fairer comparison. The new method consequently shows a huge increase in testing last week: 129,564 (up from the previous week’s 37,651). As a result of the new methodology, the percentage of positive tests went down dramatically—to 7.2% (down from 12.5% the previous week, and in contrast to what would have been a much higher percentage this week under the old method).
- The number of new COVID hospitalizations rose again last week, from 250 to 366. This constitutes an average of 52 new hospitalizations per day (up by 16 per day), another record high. Next week’s is on track to be much higher.
- The number of COVID deaths jumpted to 61 last week, nearly doubling the previous week’s count of
- The cumulative death rate since the beginning of the pandemic was a cumulative total of 826 on November 22. This constitutes a mortality rate of 1.2% of reported cases, again another slight decrease. OHA attributes this decline to increased detection of less severe illness and better medical treatment.
The report again provides information about signs, symptoms, and risk factors; racial/ethnic/age/gender demographics; recovery; outbreaks in long-term care; workplace outbreaks; outbreaks in childcare centers and schools; hospital rates; and the breakdown of cases by zip code.
Racial/Ethnic
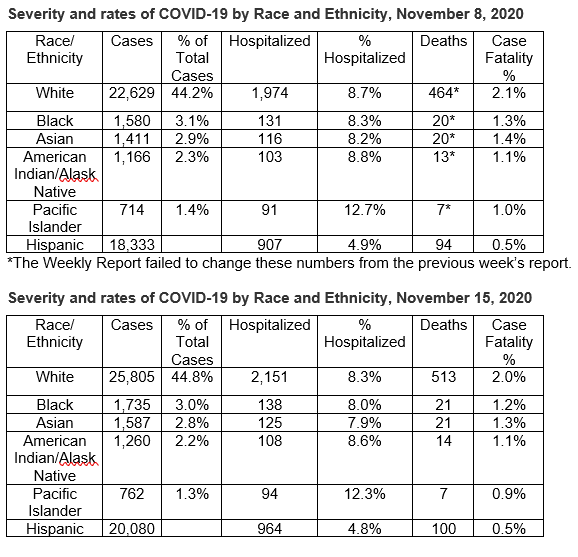
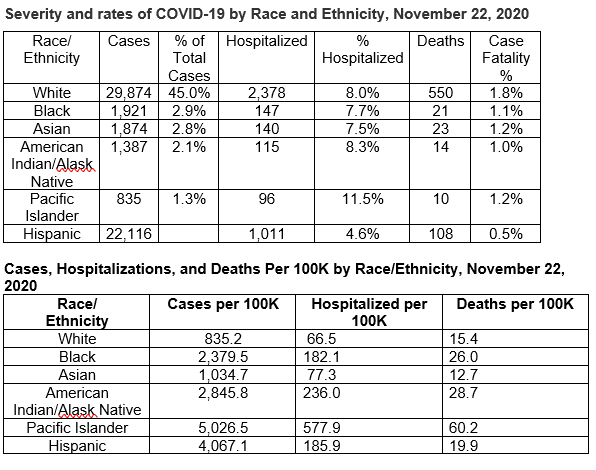
The report again demonstrates significant disparities among racial groups. You can see this in the charts below, with data that I’ve taken from the November 8 report, the November 15 report, and from this report. It allows you to see at a glance the proportion of case counts within different racial groups and ethnic groups (technically, “Hispanic” is not a race and is counted as an ethnic group, with numbers from a separate chart). They remain relatively stable.
To help you understand the racial/ethnic data reported in the weekly report, I’ve also created a new chart that shows the hospitalization and death rates per 100K population, along with the infection rates per-100K population for each racial/ethnic group.
You’ll see again how much higher the case rates per 100,000 are for most racial/ethnic groups compared to White Oregonians. Black Oregonians are nearly 3 times more likely to contract the disease than are White Oregonians, Native Americans 3.4 times more likely, Latinx Oregonians are nearly 5 times more likely, and Pacific Islanders are now 6 times more likely. The differences, while still large, have continued to go down slightly from week to week.
You’ll also again see that hospitalization rates among those who have contracted the disease are quite a bit lower for Latinx, and somewhat higher for Pacific Islanders than for the population of White Oregonians. Among those who have contracted the disease, the percentage who ultimately die of it is higher for Whites than for people of color.
However, you’ll also see in the final chart that when examined as a proportion of their populations in Oregon, the hospitalization and death rates for Blacks, Native Americans, Latinx, and especially Pacific-Islander Oregonians continue to be disproportionally high. It helps us to see why it’s so important that special outreach needs to be made to members of these racial/ethnic groups.
  The weekly report includes graphs showing how Public Health agencies are doing in contact tracing for different racial and ethnic groups. For the most part, the rate of follow-up interviews with Oregonians of color appears to be comparable to the rate with White Oregonians (actually, higher among Latinx Oregonians). Those attempts are less successful for Black Oregonians.
People with Intellectual and Developmental Disabilities
OHA is now including updates on COVID’s impact on people with Intellectual and Developmental Disabilities. These updates are based on a match between the COVID case database and information from DHS’s Office of Developmental Disabilities Services lists. These numbers will be updated on a quarterly basis.
So far in the pandemic, 219 people with intellectual or developmental disabilities have had COVID-19 to date. This includes individuals who live in group homes and in family or individual homes. To date, there are 5 deaths associated with people with intellectual or developmental disabilities.
Outbreaks at Long-Term Care Facilities
The report lists outbreaks at long-term care facilities with more than five residents that have three or more confirmed cases or at least one COVID death.
We are now seeing substantially increased numbers of infections in our facilities, reflecting the increases in the general population. It’s really unfortunate that we haven’t been able to keep the disease out of these facilities. Given the age of most of the residents, we must expect a consequent increase in hospitalizations and deaths from our long-term care population.
This week’s report lists outbreaks in 132 (another big jump, from 103) long-term care facilities that are still considered active. They are responsible for 2,101 cases (up from 1,487) and 107 deaths (up from 66).
Once a facility has gone 28 days without a new case, it is moved to the “Resolved” list. If a new outbreak occurs, it is then moved back to the Active list. Facilities currently on the Resolved list have been responsible for 2,654 cases (down from 2,668) and 341 deaths (down from 351).
In addition to the listed facilities, there are now 97 (up from 85) congregate settings with five or fewer beds that have also had three or more confirmed cases or one or more deaths. These are not listed by facility name in order to protect patient privacy.
OHA reports that since the beginning of the pandemic, there have been a total of 5,672 cases (up from 4,989) and 473 deaths (up from 442) associated with congregate care settings. That’s 57% of the cumulative deaths reported as of last week.
To date, there has still been only one death of a staff member reported.
Workplace Outbreaks
Similarly, there are separate listings for workplace outbreaks that are “active” and “resolved,” but without deaths identified by workplace. Case counts include all persons linked to the outbreak, which may include household members and other close contacts. To protect privacy, OHA is only reporting workplace outbreaks with five or more cases (workers and family members) and only for workplaces with at least 30 workers. They are listed in descending order of number of cases.
You’ll find 89 workplaces (down from 96 last week) listed as “Active” this week, totaling 2,958 cases (down from 3,097).
A facility goes onto the resolved list once it has not had a new case in 28 days.
76 workplaces (up from 60 last week) are now listed as “Resolved,” totaling 1,073 cases (up from 958 last week).
As opposed to the way that congregate living lists are now being managed, once a workplace outbreak has been in resolved status for 56 days, it is still being dropped from the list.
As is the case with the congregate living lists, OHA is now reporting cumulative cases since the beginning of the pandemic. There have been 53 deaths and 9,973 cases associated with all workplace outbreaks that have been reported to date. Cases attributed to workplace outbreaks account for 15% (down from 17.3% last week) of all cases in Oregon.
OHA has clarified that there may be cases that are being double-counted as workplace outbreaks, i.e., if a worker or family member is associated with an outbreak at more than one facility: Cases that are associated with more than one workplace outbreak will be reported in the case count for all relevant workplace outbreaks.
Prisons make up 42% of all the active workplace outbreak cases (up from 39% last week).
Childcare Outbreaks
OHA has changed the way that it reports outbreaks in childcare facilities. Previously, the Weekly Report only included names and case counts for childcare facilities that enroll 30 or more children and have five or more cases. They are now reporting all outbreaks that include two or more cases in facilities with more than 16 children.
There are now 10 (down from 14) facilities listed as active. They comprise a total of 66 cases (down from 84).
These case counts may include children, staff, and household members.
Fifteen centers are now on the Resolved list (up from 16), comprising 68 (down from 85) cases.
In addition to the listed centers, there are 18 childcare facilities (up from 2) that serve 16 or fewer children that has had an outbreak of 2 or more cases. (For privacy reasons, the smaller centers are not listed by name.)
Cases in K-12 Schools
OHA is now reporting all COVID-19 cases in schools that offer in-person instruction, distinguishing between students and staff. The report lists schools with at least 30 students that have at least one reported COVID case. The new reporting protocol applies to all public and private schools and programs.
Now that more schools have been reopening, we are starting to see increasing case numbers at more schools.
This week’s report on schools with in-person instruction shows outbreaks at 83 (up from 68) public and private schools (including elementary, middle, and high schools) around the state These outbreaks comprise 72 (up from 54 last week) cases of students and 87 (up from 60 last week) cases of staff members.
Thirty-nine schools have now been moved into the “Resolved” category (up from 31), meaning that it’s been more than 28 days since a new case was reported. They comprise 26 students and 44 staff members.
Infections by Zip Code
You’ll see that the zip code list again reveals the various hot spots around the state, presented in terms of cases per 100K residents since the beginning of the pandemic. Since these are cumulative totals, change in zip code rankings happens slowly over time.
After months of the top five (all in rural counties east of the Cascades) remaining in the same order, this week we see that the top two have reversed their positions:
- 97761 (Warm Springs in Jefferson County)
- 97818 (Boardman in Morrow County)
- 97914 (Ontario in Malheur County)
- 97838 (Hermiston in Umatilla and Morrow Counties)
- 97882 (Umatilla in Umatilla County)
97913 (Nyssa in Malheur County) remains in the on-deck spot at #6.
Here is a zip code locator for you to use as you look at the zip code numbers.
The Oregonian has created an interactive map of cases by zip code. It allows you to see COVID cases both cumulatively and with changes over the last week.
Where Are Today’s New Cases?
Note from OHA: The number of new cases reported today is lower than expected because several of the local health public departments that report daily numbers to OHA were off for the Thanksgiving holiday. OHA anticipates tomorrow’s daily case count will be unusually high.
If we put together the positive test results and new “presumptive” cases reported today, the overall number of new cases reported for is 826. Here is the breakdown by county for today:
Benton (9)
Clackamas (14)
Columbia (13)
Coos (12)
Crook (6)
Deschutes (90)
Douglas (12)
Gilliam (1)
Grant (1)
Harney (3)
Hood River (1)
Jackson (1)
Jefferson (4)
Josephine (2)
Lane (64)
Lincoln (4)
Linn (27)
Malheur (10)
Marion (168)
Morrow (8)
Multnomah (14)
Tillamook (2)
Umatilla (45)
Union (22)
Wasco (7)
Washington (297)
Yamhill (1)
And the Deaths
Oregon’s 883rd COVID-19 death is an 87-year-old woman in Union County who tested positive on Nov. 17 and died on Nov. 24 at her residence.
Oregon’s 884th COVID-19 death is an 87-year-old woman in Linn County who tested positive on Oct. 29 and died on Nov. 20 at her residence.
Oregon’s 885th COVID-19 death is a 78-year-old woman in Linn County who tested positive on Oct. 29 and died on Nov. 19 at her residence.
Additional Graphs:
   **You can find a breakdown of regional availability here.
Want to See Past Newsletters?
If there was COVID-related information in a past newsletter that you want to go back to, but find you’ve deleted it, you can always go to my legislative website (senatordembrow.com), click on “News and Information,” and you’ll find them all there. Also, if someone forwarded you this newsletter and you’d like to get it directly, you can sign up for it there.
AND FINALLY,
Here again are some resources that you will find useful:
If the above links are not providing you with answers to your questions or directing you to the help that you need, please consider me and my office to be a resource. We’ll do our best to assist you or steer you in the right direction.
Best,
 Senator Michael Dembrow
District 23
email: Sen.MichaelDembrow@oregonlegislature.gov
web: www.senatordembrow.com
phone: 503-986-1723
mail: 900 Court St NE, S-407, Salem, OR, 97301
|