|
November 7, 2020
I hope that you and your loved ones are doing well, staying healthy, and looking out for your neighbors and friends in these difficult times.
Since it’s Saturday, you’ll find only partial reporting on some of the metrics tracking coronavirus in Oregon. Instead of giving us the positive test results alone, over the weekend OHA combines those numbers with the relatively small number of those who are presumed to be positive based on their symptoms and close proximity to someone who has tested positive, but whose test results have not yet come back. But it still gives us a good idea of what’s going on.
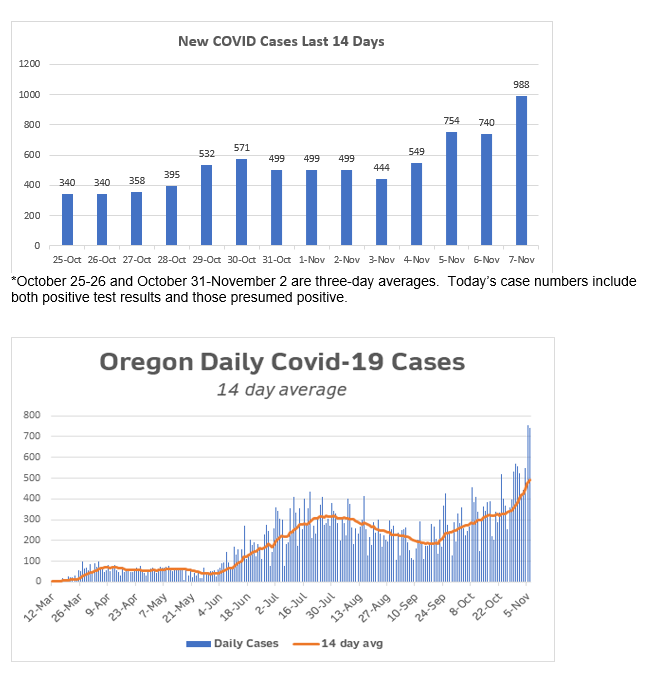
Yesterday Oregon set a new record for new COVID cases, exploding the previous record by 200 cases. The same thing happened again today, exceeding yesterday’s record by nearly the same amount. We’re reminded again of the need for the new measures to prevent the spread of COVID-19 announced yesterday by Governor Kate Brown.
We don’t get hospitalization numbers over the weekend, so we won’t know what the rate of increase is till Monday. Deaths are reported, however, and, sadly, OHA has reported the death of thirteen additional Oregonians from COVID. This is a very high number for Oregon.
As I’ve been doing on Saturdays for a while, I’m also taking the opportunity to look back at what’s going on in our individual counties on a week-by-week basis over the last month. It allows us to see the trends in the individual counties, as well as the trends for the state as a whole. We can see that the number of new cases and positivity rates are spiking once again in most counties and in the state as a whole.
I’ve finally found the time to write up an analysis of this week’s OHA COVID Weekly Report. It confirms that we are continuing to see increasing COVID rates in our long-term care facilities, our workplaces, our schools, and even in our childcare centers.
Not surprisingly, I started the day in a state of euphoria over the news that the presidential election has been called for Joe Biden and Kamala Harris. As I write this, I’m looking forward to seeing them on TV soon as our nation’s President-Elect and VP-Elect. I know it will be especially moving to see the first woman, a woman of color, in this role, a truly historic moment.
But I have to say that the news this afternoon of the continued explosion in our COVID cases, along with the rest of the information that you’ll read about in this newsletter, definitely brought me down a lot. It reminded me of just how many challenges we still have ahead of us, challenges that will require us to get beyond the partisan and ideological strife and pull together to keep ourselves, our families, our communities, our country, our planet safe.
If you’re inclined to celebrate today, please do so safely.
Let me know if you have any questions about anything you read here.
TODAY’S CORONAVIRUS AND CORONAVIRUS RESPONSE UPDATE
-
Positive Cases: OHA reports that 988 additional Oregonians have tested positive or are presumed positive (see below for definition) for COVID. OHA does not report positive test results alone over the weekend. I’ll be able to readjust the numbers on Monday to remove the presumed positives. The cumulative total for those testing positive and presumed positive since the beginning of the pandemic is 49,587.
-
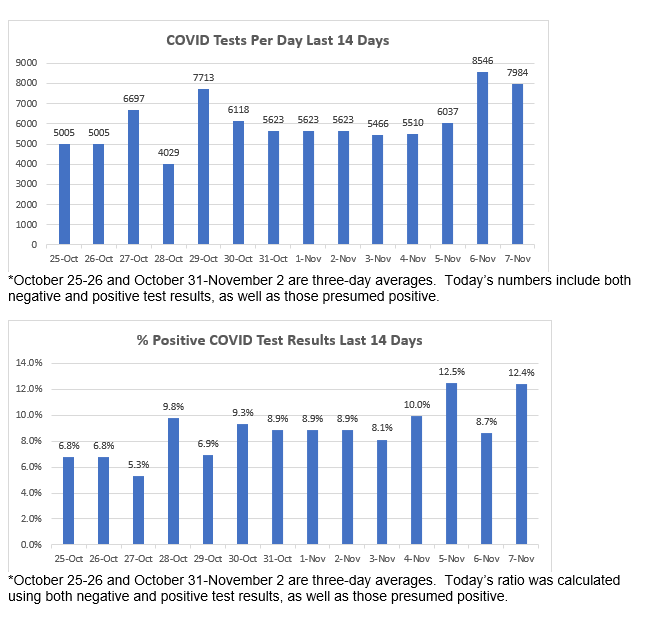
Total Tests: The number of reported tests has increased by 7,984. Today’s increase in total results also includes presumed positives in the total results, so may be a little high. I’ll readjust the numbers on Monday. The cumulative total is now 903,099.
-
Ratio: The percentage of total tests that are positive today is 12.4%. The national ratio today is 7.0%.
-
Deaths: I’m sorry to have to report 13 additional COVID deaths today. You can read about the Oregonians we lost further down in the newsletter. The total number of COVID deaths in Oregon is now 729.
-
Hospitalized: OHA does not report on hospitalizations over the weekend. The cumulative number of those who have been hospitalized with COVID thus remains at 3,378.
-
Presumptive Cases: OHA is including “presumptive COVID-19 cases” in its daily reports, consistent with recently amended guidance from the Centers for Disease Control and Prevention. A presumptive case is someone who does not yet have a positive PCR test but is showing symptoms and has had close contact with a confirmed case. If they later test positive by PCR, those will be recategorized as confirmed cases.
-
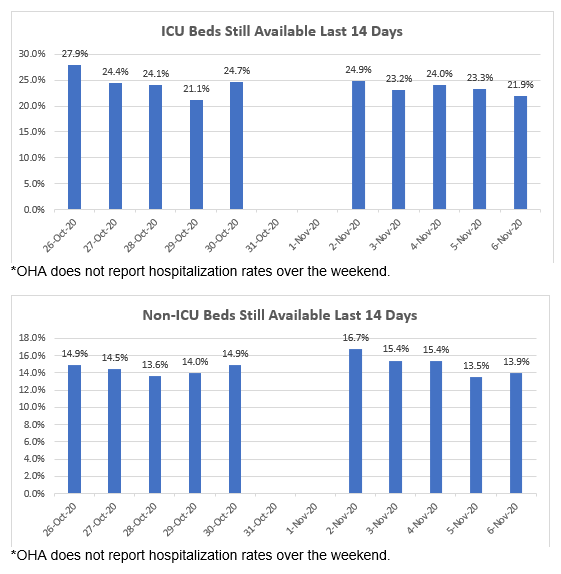
Other Hospital Information: OHA DOES NOT REPORT hospitalization information over the weekend, so the numbers below are the same as Friday’s.
- Patients Currently with COVID-19 Symptoms (who may or may not have received a positive test result yet): 266 (7 more than yesterday). Of those, 217 have already received a positive test back.
- Available ICU Beds: 156 (12 fewer than yesterday)
- Other Available Beds: 626 (28 more than yesterday).
- ICU Patients w COVID-19 Symptoms: 62 (3 fewer than yesterday).
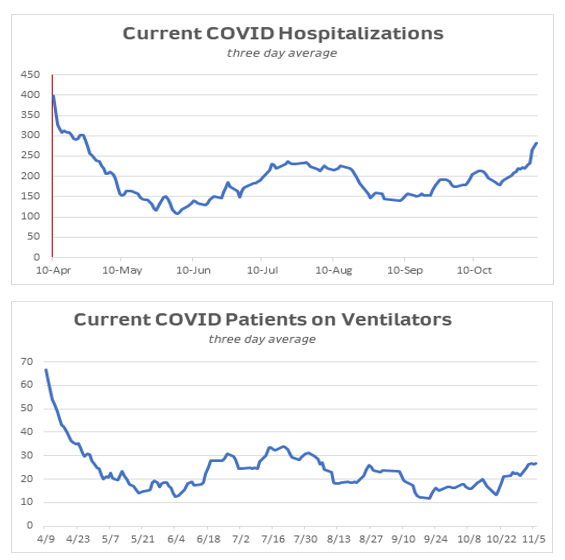
- COVID-19 Patients Currently on Ventilators: 27 (1 more than yesterday).
- Available Ventilators: 748 (7 more than yesterday).
-
Dashboard:
-
Today’s National Numbers:
-
Additional Brief Updates:
- Meeting materials for the Legislature’s Emergency Board meeting on Monday have now been posted. They include information about the specific allocations that will be proposed. Here is the meeting agenda page, which will include the link to the video for the meeting, and the meeting materials page.
What’s Going On In the Counties?
Each Saturday I’m tracking how individual counties are doing, especially now that we’re seeing big increases in cases around the state. The key metrics that OHA is watching are the number of positive test results (per 100K residents) and the percentage of positive test results among all tests administered; the latter will be the more important way for us to see if the infection rate is increasing as a result of reopening and increased testing. (They also are looking at hospital capacity and changes in hospitalization rates, but I don’t have that information by county.)
But first, I want to reproduce the current INTERACTIVE COUNTY DASHBOARD that the OHA has on its website. It shows case counts and total testing by county since the pandemic, scaled to cases per 100,000, so that we can see how the infection is penetrating the various counties, irrespective of their population size. This is what we see as of November 6:
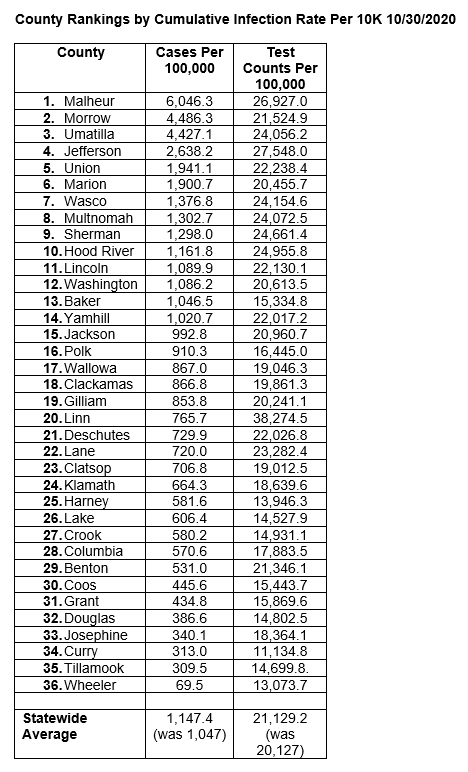 This is a useful view because it allows us to see the infection rate within each county, irrespective of their total populations. Remember, though, that these are CUMULATIVE cases since the beginning of the pandemic. If you look at the rankings, you can see the lingering effects of outbreaks at workplaces and other congregate settings that occurred months ago. It also means that more recent outbreaks may not lead to big changes in the above rankings. In fact, there are only a handful of moves up or down by one or two spots.
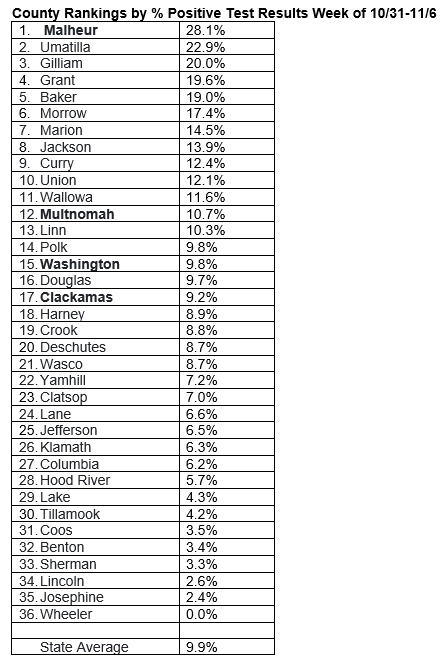
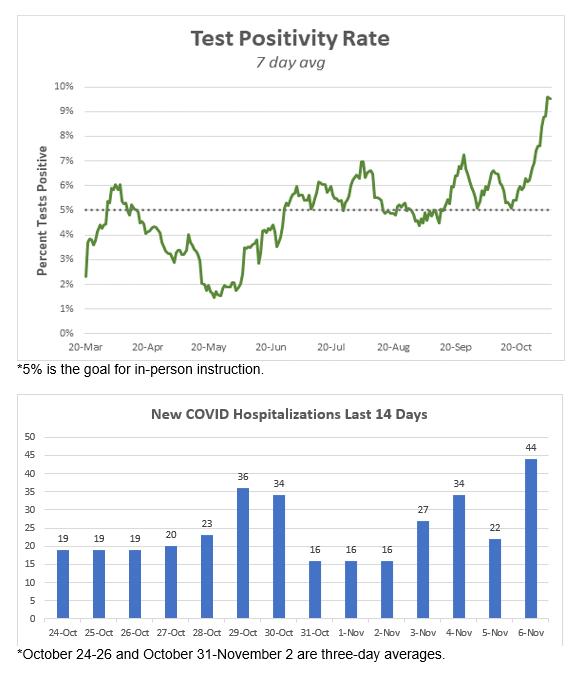
While the cumulative infection rate is an important metric to look at, I believe an even more important metric is the rate of test results coming in positive. The more you test, the lower that number should be, as you’re not just testing people with clear symptoms of COVID. Anything over 10% is cause for real concern. Our school reopening target is 5%.
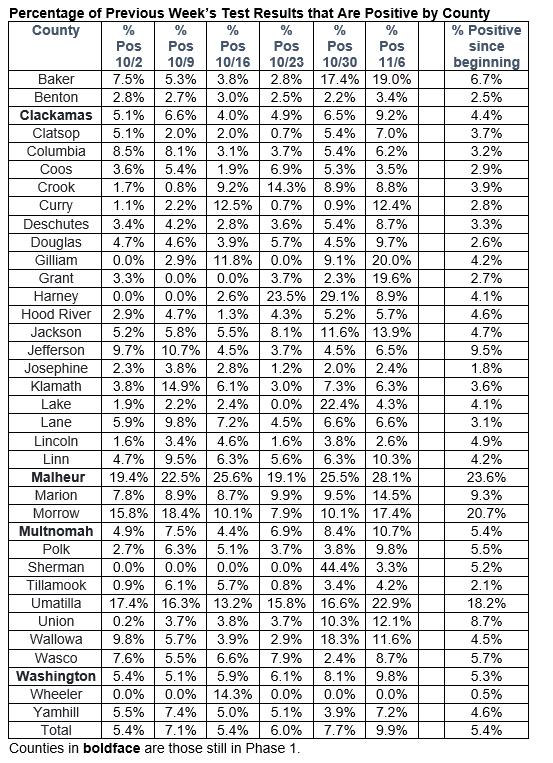
Here’s a table I’ve created that shows county rankings by the most recent week’s positivity rate. When you compare it to the previous table. you get a better sense of what’s happening in the individual counties from week to week. The most striking changes tend to come from low-population frontier counties (such as Gilliam, Grant, and Baker), where a few new cases can make a real difference and move these counties right up to the top of the rankings.
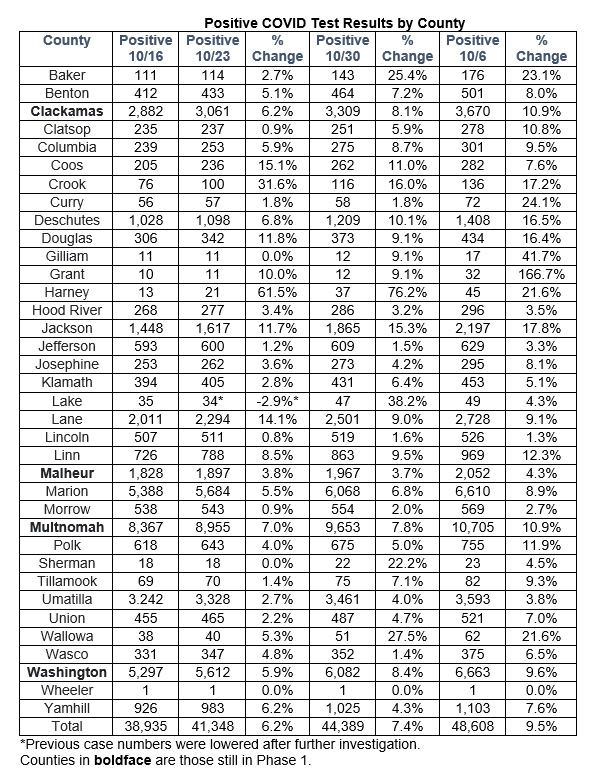
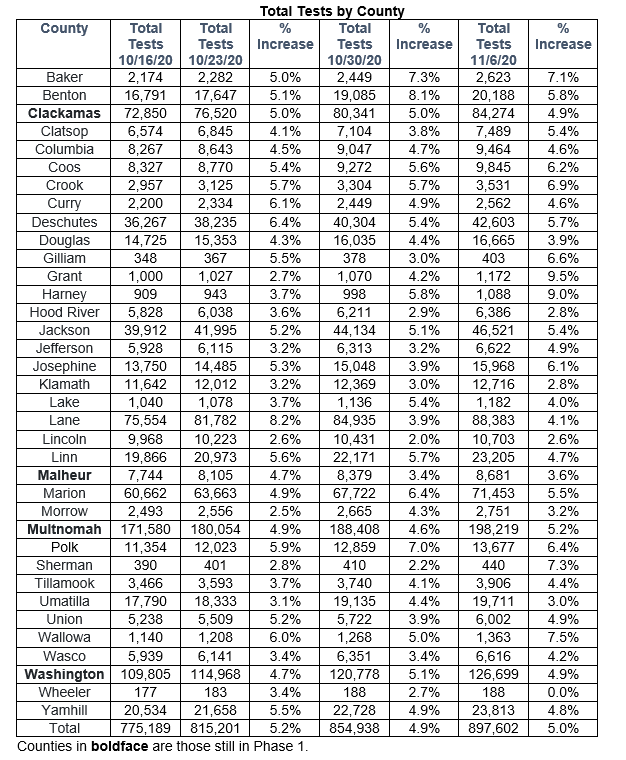
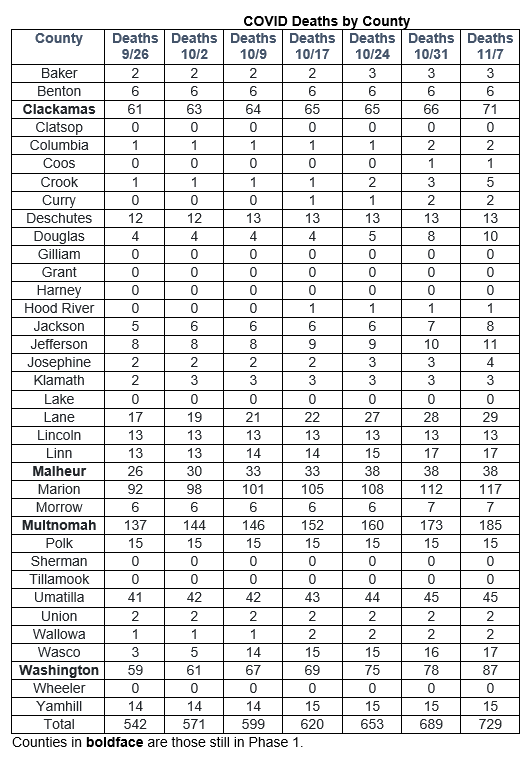
 Looking at the tables below, showing the new cases, new tests, positivity rates, and deaths in the different counties, we can see what’s been going on over the last week. You’ll see the effects of the record number of new cases, which are unfortunately outpacing the number of new tests. As a result, you’ll see a return to high positivity rates for individual counties and for the state as a whole. Oregon’s statewide positivity rate for the week is barely below that 10% danger zone.
In order to make the current trends in positive percentages more obvious, I’m again showing you the week-over-week percentages, along with the overall percentage of positive cases for each county since the beginning of the pandemic.
    For additional data on the counties, here is the latest County Watch List Data. It shows infections per 100K, along with the number and rate of “sporadic cases” (also known as “community spread cases”): those that cannot be traced to a particular source.
If you’re interested in seeing an even more granular picture of what’s happening on the ground, cumulatively and over the last week, The Oregonian has created an interactive map of cases by zip code.
Latest OHA Weekly COVID Report Released
OHA released its WEEKLY COVID REPORT late Wednesday. It is again a very comprehensive snapshot of different aspects of transmission of the disease in Oregon over the past week or so. It confirms what we’ve been seeing in our daily reports: we are seeing record rates of transmission in Oregon, , accompanied by low testing rates and increases in test positivity, hospitalizations, and deaths. It continues to show ongoing disproportionality among racial and ethnic groups.
Here are some of OHA’s broad observations of where we are now, based on data from October 26-November 1:
- We see once again an increase in the number of new cases. Last week OHA recorded 3,542 new cases of COVID-19 infection—up a record 34% from last week’s tally of 2,642. This is again a new record for total weekly infections since the pandemic began.
- The cumulative statewide infection rate is now 1,085 cases per 100,000 Oregonians, just over 1% of the population.
- The number of tests reported improved again: by 10% to 34,591. This is still far below where it needs to be to capture asymptomatic cases.
- The percentage of positive test results rose by nearly two full percentage points to 8.4%.
- Last week the number of newly reported deaths rose again 28 to 37.
- The cumulative death rate since the beginning of the pandemic remains at 15.5 deaths per 100,000 Oregonians, with a cumulative total of 692 on November 1. This constitutes a mortality rate of 1.5% of reported cases.
- The number of new COVID hospitalizations rose again last week, from 145 to 160 new COVID hospitalizations, an average of 23 new hospitalizations per day.
- The age group with the highest incidence of reported infection continues to be 20–29-year-olds, with rates decreasing in subsequent decades of life.
The report again provides information about signs, symptoms, and risk factors; racial/ethnic/age/gender demographics; recovery; outbreaks in long-term care; workplace outbreaks; outbreaks in childcare centers and schools; hospital rates; and the breakdown of cases by zip code.
Racial/Ethnic
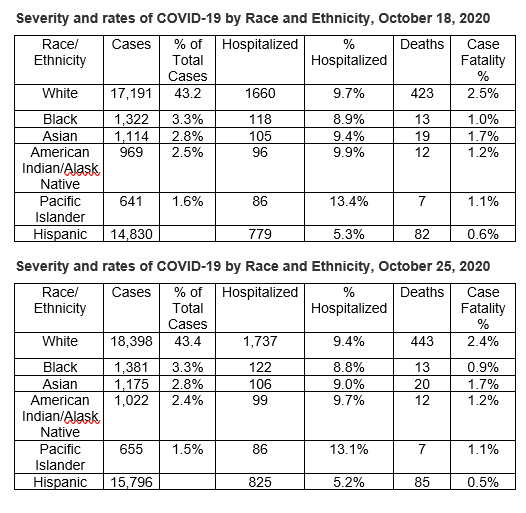
The report again demonstrates significant disparities among racial groups. You can see this in the charts below, with data that I’ve taken from the October 18 report, the October 25 report, and from this report. It allows you to see at a glance the proportion of case counts within different racial groups and ethnic groups (technically, “Hispanic” is not a race and is counted as an ethnic group, with numbers from a separate chart). They remain relatively stable.
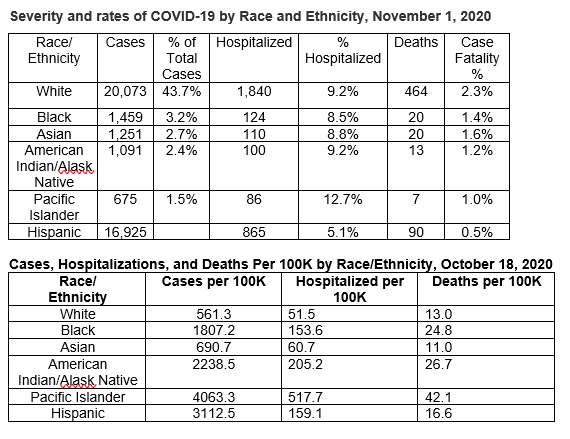
To help you understand the racial/ethnic data reported in the weekly report, I’ve also created a new chart that shows the hospitalization and death rates per 100K population, along with the infection rates per-100K population for each racial/ethnic group.
You’ll see again how much higher the case rates per 100,000 are for most racial/ethnic groups compared to White Oregonians. Black Oregonians are 3.2 times more likely to contract the disease than are White Oregonians, Native Americans just under 4 times more likely, Latinx Oregonians are 5.6 times more likely, and Pacific Islanders are now 7.2 times more likely. The differences, while still extremely large, have continued to go down slightly from week to week.
You’ll also again see that hospitalization rates among those who have contracted the disease are somewhat lower for Blacks, quite a bit lower for Latinx, and quite a bit higher for Pacific Islanders than for the population of White Oregonians. Among those who have contracted the disease, the percentage who ultimately die of it is much higher for Whites than for people of color.
However, you’ll also see in the final chart that when examined as a proportion of their populations in Oregon, the hospitalization and death rates for Blacks, Native Americans, Latinx, and especially Pacific-Islander Oregonians continue to be disproportionally high. It helps us to see why it’s so important that special outreach needs to be made to members of these racial/ethnic groups.
  The weekly report includes graphs showing how Public Health agencies are doing in contact tracing for different racial and ethnic groups. For the most part, the rate of follow-up interviews with Oregonians of color appears to be comparable to the rate with White Oregonians (actually, higher among Latinx Oregonians). Those attempts are less successful for Black Oregonians.
Outbreaks at Long-Term Care Facilities
The report lists outbreaks at long-term care facilities with more than five residents that have three or more confirmed cases or at least one COVID death.
We are now seeing increasing infections in our facilities, reflecting the increases in the general population.
This week’s report lists outbreaks in 71 (up from 62) long-term care facilities that are still considered active. They are responsible for 805 cases (up from 634) and 47 deaths (up from 38).
Once a facility has gone 28 days without a new case, it is moved to the “Resolved” list. , There are now 159 outbreaks on the Resolved list. This is a BIG increase from last week’s 62, but there’s a good reason for that: OHA was previously dropping facilities from the resolved list after 56 days, after which there was no way for us to see in one place all the facilities that had ever experienced outbreaks.
I asked OHA to keep this information in the public eye, and they have agreed to do that. The facilities are listed in order of first date of outbreak. (I’ve asked that they be ordered alphabetically in the future for ease of access.) This list will obviously grow each week.
Facilities on the Resolved list have been responsible for 2,544 cases and 333 deaths.
In addition to the listed facilities, there are now 68 (up from 65) congregate settings with five or fewer beds that have also had three or more confirmed cases or one or more deaths. These are not listed by facility name in order to protect patient privacy.
OHA reports that in total to date, there have been 4,200 cases up from 3,515) and 402 deaths (up from 385) associated with congregate care settings. That’s 58% of the cumulative deaths reported as of last week (a slight reduction from the previous week’.
To date, there has still been only one death of a staff member reported.
Workplace Outbreaks
Similarly, there are separate listings for workplace outbreaks that are “active” and “resolved,” but without deaths identified by workplace. Case counts include all persons linked to the outbreak, which may include household members and other close contacts. To protect privacy, OHA is only reporting workplace outbreaks with five or more cases (workers and family members) and only for workplaces with at least 30 workers. They are listed in descending order of number of cases.
You’ll find 76 workplaces (up from 75 last week) listed as “Active” this week, totaling 2,597 (down from 2,631).
A facility goes onto the resolved list once it has not had a new case in 28 days.
55 workplaces (up from 42 last week) are now listed as “Resolved,” totaling 900 cases (up from 658 last week).
As opposed to the way that congregate living lists are now being managed, once a workplace outbreak has been in resolved status for 56 days, it is still being dropped from the list.
As is the case with the congregate living lists, OHA is now reporting cumulative cases since the beginning of the pandemic. There have been 37 deaths (up from 35 last week) and 8,605 cases (up from 8,172 last week) associated with all workplace outbreaks that have been reported to date. Cases attributed to workplace outbreaks account for 18.7% of all cases in Oregon.
OHA has clarified that there may be cases that are being double-counted as workplace outbreaks, i.e., if a worker or family member is associated with an outbreak at more than one facility: Cases that are associated with more than one workplace outbreak will be reported in the case count for all relevant workplace outbreaks.
It’s good to see that one of the prisons in Eastern Oregon has been moved from the Active List to the Resolved List. Prisons now make up They make up 42% of all the active workplace outbreak cases (down from 46% last week).
Childcare Outbreaks
OHA has changed the way that it reports outbreaks in childcare facilities. Previously, the Weekly Report only included names and case counts for childcare facilities that enroll 30 or more children and have five or more cases. They are now reporting all outbreaks that include two or more cases in facilities with more than 16 children.
There are now 16 (up from 15) facilities listed as active. They comprise a total of 71 cases (up from 66).
These case counts may include children, staff, and household members.
Nine centers are now on the Resolved list (up from 6), comprising 68 (up from 45) cases.
In addition to the listed centers, there is one childcare facility that serves 16 or fewer children that has had an outbreak of 2 or more cases. (For privacy reasons, the smaller centers are not listed by name.)
Cases in K-12 Schools
OHA is now reporting all COVID-19 cases in schools that offer in-person instruction, distinguishing between students and staff. The report lists schools with at least 30 students that have at least one reported COVID case.
The new reporting protocol applies to all public and private schools and programs.
This week’s report on schools with in-person instruction shows 23 (up from 16 last week) cases of students and 24 (same as last week) cases of staff members at a total of 24 (up from 20) public and private schools (including elementary, middle, and high schools) around the state.
Nineteen schools have now been moved into the “Resolved” category (up from 12), meaning that it’s been more than 28 days since a new case was reported. They comprise 11 students and 27 staff members.
Infections by Zip Code
You’ll see that the zip code list again reveals the various hot spots around the state, presented in terms of cases per 100K residents since the beginning of the pandemic. Since these are cumulative totals, change in zip code rankings happens slowly over time.
The top five are exactly the same (from Umatilla/Morrow, Jefferson, and Malheur Counties) as they’ve been for the last month or more:
- 97818 (Boardman in Morrow County)
- 97761 (Warm Springs in Jefferson County)
- 97914 (Ontario in Malheur County)
- 97838 (Hermiston in Umatilla and Morrow Counties)
- 97882 (Umatilla in Umatilla County)
97913 (Nyssa in Malheur County) remains in the on-deck spot at #6.
Here is a zip code locator for you to use as you look at the zip code numbers.
The Oregonian has created an interactive map of cases by zip code. It allows you to see COVID cases both cumulatively and with changes over the last week.
Saturday Wildfire Recovery/Response Update
No changes to report on the remaining big fires, including the new Leslie Gulch fire in Eastern Oregon. You can find maps and up-to-the-minute details on the individual fires at OEM’s State of Oregon Fires and Hotspots Dashboard.
We don’t receive updates from the Office of Emergency Management over the weekend. Here again are the updated statistics regarding Human Impacts:
- The number of fatalities (9) and missing persons (1) remains the same.
- The number of residences reported destroyed remains at 4,026. More than 1,400 structures other than residences have also been destroyed.
- According to the Red Cross, the number of Oregonians in emergency housing has continued to go down slightly over the last few days. 1,066 Oregonians now remain in emergency housing, but all are now in hotels/motels and other short-term settings. There are no longer any evacuees living in shelters, either in RVs and tents or in indoor congregate shelters.
- The number of Oregonians who have registered with FEMA for individual assistance has continued to increase and is currently at 24,415. FEMA has already approved for $23.74 million in assistance grants.
- Still, if you know of anyone who has NOT yet registered, please direct them the following:
- OEM is now maintaining a real-time Wildfire and Recovery Tracker that will give you up-to-the-moment statistics on a variety of metrics related to recovery efforts. Check it out for the latest on the state’s recovery efforts
Where Are Today’s New Cases?
If we put together the positive test results and new “presumptive” cases reported today, the overall number of new cases for today is 988. More than half are from the Portland Tri-County region, with Multnomah County setting another record in today’s report. Here is the breakdown by county for today:
Baker (5)
Benton (8)
Clackamas (129)
Clatsop (4)
Columbia (3)
Coos (4)
Crook (2)
Deschutes (32)
Douglas (23)
Grant (17)
Harney (1)
Hood River (1)
Jackson (78)
Jefferson (4)
Josephine (10)
Klamath (12)
Lane (75)
Lincoln (3)
Linn (12)
Malheur (15)
Marion (75)
Morrow (2)
Multnomah (240)
Polk (12)
Tillamook (4)
Umatilla (27)
Union (10)
Wallowa (1)
Washco (10)
Washington (133)
Yamhill (45)
And the Deaths
Oregon’s 717th COVID-19 death is an 84-year-old woman in Multnomah County who tested positive on Sept. 25 and died on Oct. 8 at her residence.
Oregon’s 718th COVID-19 death is a 79-year-old man in Lane County who tested positive on Oct. 5 and died on Oct. 19 at his residence.
Oregon’s 719th COVID-19 death is a 64-year-old man in Multnomah County who tested positive on Oct. 15 and died on Nov. 6 at OHSU.
Oregon’s 720th COVID-19 death is a 58-year-old woman in Washington County who tested positive on Oct. 22 and died on Oct. 31 at Tuality Community Hospital.
Oregon’s 721st COVID-19 death is an 82-year-old man in Washington County who tested positive on Oct. 26 and died on Oct. 30 at Legacy Emmanuel Medical Center.
Oregon’s 722nd COVID-19 death is an 84-year-old woman in Marion County who tested positive on Oct. 4 and died on Oct. 23 at her residence.
Oregon’s 723rd COVID-19 death is a 94-year-old woman in Clackamas County who tested positive on Oct. 17 and died on Oct. 28 at her residence.
Oregon’s 724th COVID-19 death is a 58-year-old woman in Multnomah County who tested positive on Aug. 6 and died on Oct. 29 at her residence.
Oregon’s 725th COVID-19 death is a 91-year-old woman in Washington County who tested positive on Oct. 16 and died on Oct. 24 at Legacy Meridian Park Medical Center.
Oregon’s 726th COVID-19 death is an 83-year-old woman in Washington County who tested positive on Oct. 18 and died on Oct. 30 at Providence St. Vincent Medical Center.
Oregon’s 727th COVID-19 death is an 86-year-old man in Multnomah County who tested positive on Oct. 14 and died on Nov. 2 at Legacy Mount Hood Medical Center.
Oregon’s 728th COVID-19 death is a 90-year-old man in Multnomah County who tested positive on Oct. 13 and died on Oct. 30 at his residence.
Oregon’s 729th COVID-19 death is an 80-year-old woman in Multnomah County who tested positive on Oct. 5 and died on Oct. 13 at her residence.
Additional Graphs:
     Want to See Past Newsletters?
If there was COVID-related information in a past newsletter that you want to go back to, but find you’ve deleted it, you can always go to my legislative website (senatordembrow.com), click on “News and Information,” and you’ll find them all there. Also, if someone forwarded you this newsletter and you’d like to get it directly, you can sign up for it there.
AND FINALLY,
Here again are some resources that you will find useful:
If the above links are not providing you with answers to your questions or directing you to the help that you need, please consider me and my office to be a resource. We’ll do our best to assist you or steer you in the right direction.
Best,
 Senator Michael Dembrow
District 23
email: Sen.MichaelDembrow@oregonlegislature.gov
web: www.senatordembrow.com
phone: 503-986-1723
mail: 900 Court St NE, S-407, Salem, OR, 97301
|