|
November 1, 2020
I hope that you and your loved ones are doing well, staying healthy, and looking out for your neighbors and friends in these difficult times.
Since it’s Sunday, you’ll find only partial reporting on some of the metrics tracking coronavirus in Oregon. Instead of giving us the positive test results alone, over the weekend OHA combines those numbers with the relatively small number of those who are presumed to be positive based on their symptoms and close proximity to someone who has tested positive, but whose test results have not yet come back. But it still gives us a good idea of what’s going on.
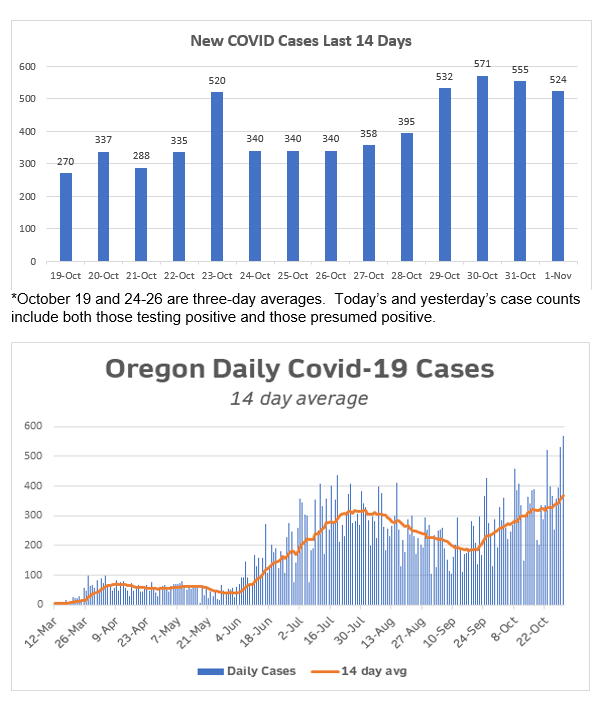
Though newly-reported case numbers are down a little today, they are still above 500 today, for the fourth day in a row. Prior to this streak, we only had a couple of days when case counts were above 400.
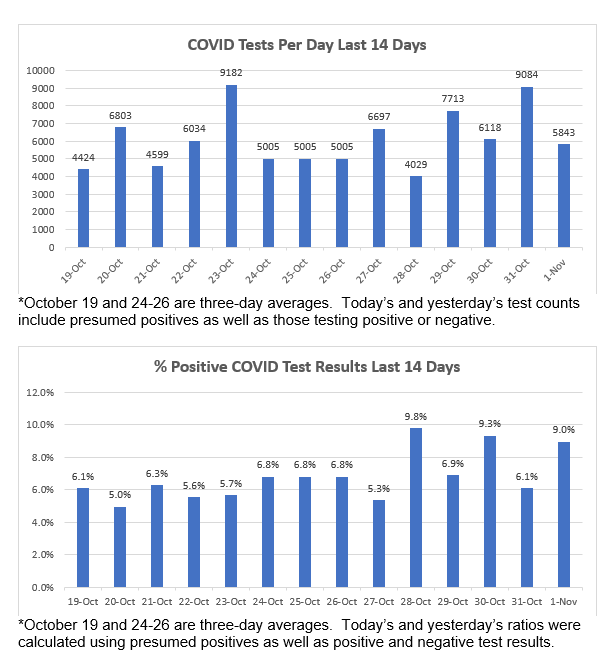
We unfortunately can’t say that the increased number of positive cases is the result of a big increase in testing; in fact, today’s number of reported tests is much lower than it was yesterday. As a result, we unfortunately see another jump in our positivity rate for today; it’s now back up at 9%.
We don’t get hospitalization numbers over the weekend, so we won’t know what the rate of increase is till tomorrow. Deaths are reported, and there’s a glimmer of good news there--the number of newly-reported deaths has declined to 2 today (down from 14 yesterday). Having said that, it’s not unusual to see lower deaths reported on Sunday; we see the same phenomenon on the national level.
As I’ve been doing on Sundays, I’m also providing updated information about how COVID is affecting people of different ages. We see the same trends as in past weeks: COVID cases are most prevalent in younger people, but they tend to be less likely to be hospitalized or die from the disease. When it’s passed on to older people, however, COVID becomes much more dangerous.
I also report on the latest update to the state’s COVID epidemiological model, which again lays out three scenarios for the likely spread of the disease. Given our recent increases, it appears that the pessimistic scenario is the most likely right now.
Today’s newsletter has nothing new to report on firefighting or the response effort. We should be getting our next updates tomorrow. In the meantime, you’ll find links to real-time dashboards for both firefighting and the response effort further down in the newsletter.
Please let me know if you have any questions about anything you read here.
TODAY’S CORONAVIRUS AND CORONAVIRUS RESPONSE UPDATE
-
Positive Cases: OHA reports that 524 additional Oregonians have tested positive or are presumed positive (see below for definition) for COVID. OHA does not report positive test results alone over the weekend. I’ll be able to readjust the numbers on Monday to remove the presumed positives. The cumulative total for those testing positive and presumed positive since the beginning of the pandemic is 45,429.
-
Total Tests: The number of reported tests has increased by 5,843. Today’s increase in total results also includes presumed positives in the total results, so may be a little high. I’ll readjust the numbers on Monday. The cumulative total is now 867,792.
-
Ratio: The percentage of total tests that are positive today is 9.0%. The national ratio today is 6.9%.
-
Deaths: I’m sorry to have to report 2 additional COVID deaths today. You can read about the Oregonians we lost further down in the newsletter. The total number of COVID deaths in Oregon is now 691.
-
Hospitalized: OHA does not report on hospitalizations over the weekend. The cumulative number of those who have been hospitalized with COVID thus remains at 3,204.
-
Presumptive Cases: OHA is including “presumptive COVID-19 cases” in its daily reports, consistent with recently amended guidance from the Centers for Disease Control and Prevention. A presumptive case is someone who does not yet have a positive PCR test but is showing symptoms and has had close contact with a confirmed case. If they later test positive by PCR, those will be recategorized as confirmed cases.
-
Other Hospital Information: OHA DOES NOT REPORT hospitalization information over the weekend, so the numbers below are the same as Friday’s.
- Patients Currently with COVID-19 Symptoms (who may or may not have received a positive test result yet): 211 (24 fewer than yesterday). Of those, 165 have already received a positive test back.
- Available ICU Beds: 175 (23 more than yesterday)
- Other Available Beds: 675 (45 more than yesterday).
- ICU Patients w COVID-19 Symptoms: 61 (1 fewer than yesterday).
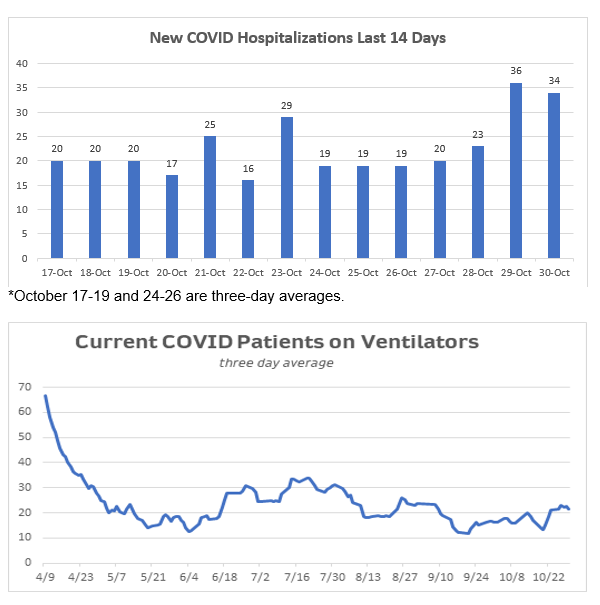
- COVID-19 Patients Currently on Ventilators: 23 (same as yesterday).
- Available Ventilators: 747 (same as yesterday).
-
Dashboard:
-
Today’s National Numbers:
-
Additional Brief Updates:
-
El Pais has a fascinating piece (translated into English) with graphic demonstrations of how COVID is spread in social gatherings, in bars, and in classrooms, and what can be done to reduce the spread in each setting. Check it out.
- Preliminary reports from the wildfires suggest that those homes in the “Wildland-Urban Interface” (the so-called “WUI”) that had been constructed in a fire-resistant manner and whose grounds were designed to inhibit the spread of fire did much better than those that were untreated. It seems clear that we are going to have to pay a lot more attention to these considerations in the future, and I can tell you that legislators are already discussing ways to encourage practices that can help inhibit fire damage. A key player in that effort will be Oregon State University’s Extension Service, which has scheduled a free webinar on Tuesday, November 10, on “Fire and Plants: How to Reduce Your Risk of Wildfire.” You can read more about it and sign up here.
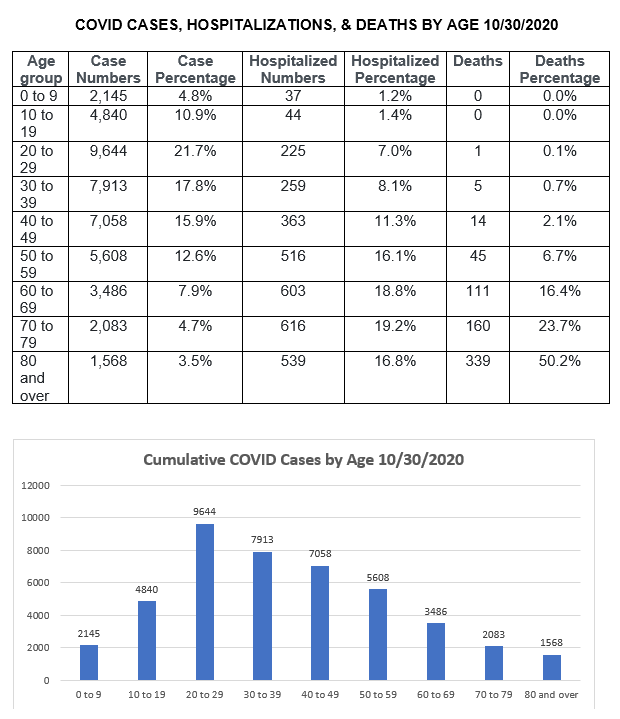
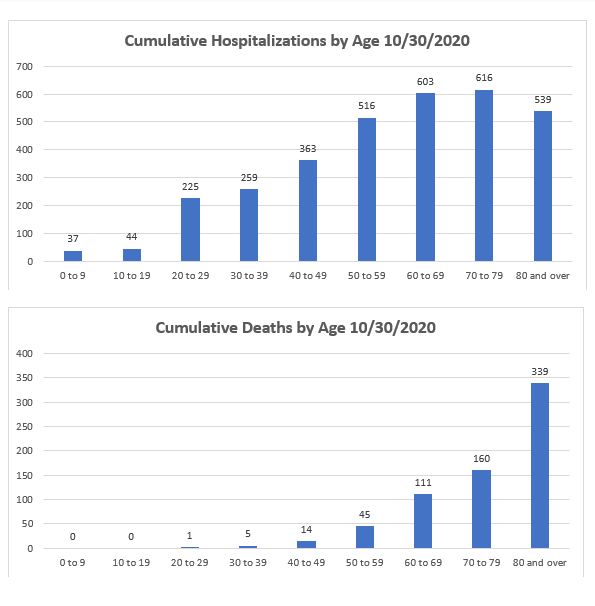
Looking at Age Metrics
Here again are this week’s statewide case, hospitalization, and death metrics by age. Here is updated information as of October 9. The percentages for each category have again not really moved much. You’ll see again that younger people have come to dominate the category of new cases: 71% of all cases so far have been in Oregonians below younger than 50.
However, effects of the disease become much more severe when it is transmitted to older people. 71% of COVID hospitalizations are among those OVER the age of 50. Deaths remain dominated by those above the age of 70 (more than three-fourths of all deaths), though we continue to see losses among people in their 50s and younger.
Those who eventually die of the disease are increasingly to be found in the 80-and-over category. More than half of all deaths are now in this category. I’m speculating, but this may be due to improvements in COVID treatments that are making more of a difference with younger patients. I will add that in the last week we see a slightly higher proportion of those in their 60s who died of the disease.
  Disease Model Update: A Troubling Roadmap
OHA has released the latest COVID Model Update from the Institute for Disease Modeling. It’s based on data through October 22.
At that time we were seeing a stabilization of our case and hospitalization numbers (and perhaps even a slight reduction). As you know, that has changed in the week after these data were collected. Those data do not include the big spikes of last week. If we include those new increases, the prognosis becomes bleaker. I’ll speak more to that at the end of this summary.
The model now assumes that one-third of cases are showing up in positive test results or are presumed positive. The remaining 2/3 are untested, mainly asymptomatic, and potentially spreading the disease. In the previous model the detected rate was approximately one-fourth, so this model assumes that more cases are being diagnosed now. The report does not discuss or explain this change, but it’s presumably related to hospital numbers, assuming that a certain percentage of cases (whether detected or undetected) will turn severe and require hospitalization. (I’ll try to get an explanation from OHA and will share it.)
Based on the data seen up to October 22, the modelers believe that the “Re” (Effective Reproduction Number, the number of secondary cases generated by a single case) in Oregon went down slightly to approximately 1.0. If the Re level continues, we will continue to see small increases in cases here in Oregon. If we’re able to get that reproduction number back below 1.0, where it was in August and early September, we’ll see the number of new cases begin to decline.
The projection report again provides us with three possible scenarios looking forward, for the next month: “Transmission Continues As-Is,” “Transmission Increases Again,” and “Transmission Returns to August Level.” The scenarios all assume that we are continuing at our current state of testing. They peg that number at a conservative 5,500 per day.
Scenario 1: Transmission Continues As Is:
If we continue as we are now (with an Re of 1.0), by November 19 we’ll see an ongoing flattening of the number of cases we were seeing as of October 23. The number of newly diagnosed cases will be approximately 380 per day (up from the previous model’s 340), totaling approximately 1,000 if we include undetected cases. The number of daily new severe cases (i.e., requiring hospitalization) will be 22.
Scenario 2: Transmission Increases Again:
If we assume that transmission increases by 5 percentage points (with an Re of 1.16) and continues at that level over the next month, the COVID-19 cases will increase significantly. The model projects that by November 19 the number of newly diagnosed cases will be approximately 520 per day, and the total of detected and undetected cases will be 1,700. The number of hospitalizations will rise to 31 per day.
Scenario 3: Returns to August Level:
This scenario assumes that we can get back to where we were in August, which would require a 6% reduction from the October 22 rate of transmission, getting us back to an Re of 0.82. If we can do that, the model predicts that by November 19 new case numbers will be in decline. The daily rate of newly detected case will return to approximately 230 per day, and the total number of detected and undetected cases will be 600. Hospitalization rates will be approximately 16 per day.
Needless to say, we’d love to see this final scenario come to fruition. That will likely be a real challenge, though. Those August numbers were prior to any schools or universities going back into session, and prior to the worldwide “Fall Surge” that we’re currently seeing. It will be difficult for Oregon to resist those trends.
In fact, in the week since the close date for this model’s data, we were already seeing numbers more consistent with the “increase” model. The report itself notes this: “Unfortunately, epidemiologic data and hospital occupancy data over the last few days suggest that cases have been increasing again rather than remaining steady.” It seems much more likely that our case counts will be at the Scenario 2 level as of November 19. And with the holiday season coming, the risks of even higher transmission are clear. We’ll know more over the next week or two, as we see if last week’s spikes were anomalies or part of a new trend.
The modelers again conclude their report with the following observations:
- While the projected increases in infections is alarming, the virus is very sensitive to changes in transmission. Oregonians can reverse these trends; if they redouble prevention efforts and return to the August transmission level, cases will start to decline again.
- The model focuses on statewide averages and doesn’t account for regional variations or the clear and present disproportionate impacts experienced by different racial/ethnic groups.
- The modelers are not predicting which scenario will prevail. Transmission levels will be dependent on adherence to the guidance regarding physical distancing, face coverings, hygiene, self-quarantining of contacts, and self-isolation of cases.
- In addition, it is important to note that Re is an average: the average number of secondary cases that a single case generates. But that doesn’t mean that everyone who has the disease will spread it to that many others. Transmission varies by individuals and by circumstances. Some individuals and some social/work situations spread the disease much more than others.
- These patterns highlight the need for everyone, including those without symptoms, even when they are with friends and family, to adhere to public health guidance. [It will keep you safe, your friends and family safe, and our communities safe.]
Sunday Wildfire Recovery/Response Update
ODF does not report any changes in yesterday’s wildfire containment levels today. You can find maps and up-to-the-minute details on the individual fires at OEM’s State of Oregon Fires and Hotspots Dashboard.
- We didn’t receive a formal update on wildlife recovery from the Office of Emergency Management today. However, you can check out the state’s recovery in real time at the OEM’s Wildfire and Recovery Tracker.
Where Are Today’s New Cases?
If we put together the positive test results and new “presumptive” cases reported today, the overall number of new cases for today is 555. Nearly half of today’s new cases are again from the Portland Tri-County area. Here is the breakdown by county for today:
PORTLAND, Ore. — COVID-19 has claimed two more lives in Oregon, raising the state’s death toll to 691, the Oregon Health Authority reported at 12:01 a.m. today.
The new confirmed and presumptive COVID-19 cases reported today are in the following counties: Benton (1), Clackamas (35), Clatsop (3), Columbia (5), Coos (6), Curry (2), Deschutes (28), Douglas (8), Grant (2), Hood River (2), Jackson (36), Klamath (4), Lane (35), Lincoln (2), Linn (7), Malheur (8), Marion (132), Morrow (2), Multnomah (116), Polk (5), Umatilla (5), Union (1), Wallowa (1), Wasco (4), Washington (67), Yamhill (7).
Benton (1)
Clackamas (35)
Clatsop (3)
Columbia (5)
Coos (6)
Curry (2)
Deschutes (28)
Douglas (8)
Grant (2)
Hood River (2)
Jackson (36)
Klamath (4)
Lane (35)
Lincoln (2)
Linn (7)
Malheur (8)
Marion (132)
Morrow (2)
Multnomah (116)
Polk (5)
Umatilla (5)
Union (1)
Wallowa (1)
Wasco (4)
Washington (67)
Yamhill (7)
And the Deaths
Oregon’s 690th COVID-19 death is a 73-year-old woman in Crook County who tested positive on Oct. 15 and died on Oct. 31 at St. Charles Medical Center Bend.
Oregon’s 691st COVID-19 death is a 90-year-old woman in Washington County who tested positive on Oct. 8 and died on Oct. 31 at Providence St. Vincent Medical Center.
NOTE: OHA has provided updated information about Oregon’s 689th COVID-19 death. He was originally identified as a 78-year-old Multnomah county resident but was later identified as a Clackamas county resident. Death totals by county have been updated to reflect this change.
Additional Graphs:
   Want to See Past Newsletters?
If there was COVID-related information in a past newsletter that you want to go back to, but find you’ve deleted it, you can always go to my legislative website (senatordembrow.com), click on “News and Information,” and you’ll find them all there. Also, if someone forwarded you this newsletter and you’d like to get it directly, you can sign up for it there.
AND FINALLY,
Here again are some resources that you will find useful:
If the above links are not providing you with answers to your questions or directing you to the help that you need, please consider me and my office to be a resource. We’ll do our best to assist you or steer you in the right direction.
Best,
 Senator Michael Dembrow
District 23
email: Sen.MichaelDembrow@oregonlegislature.gov
web: www.senatordembrow.com
phone: 503-986-1723
mail: 900 Court St NE, S-407, Salem, OR, 97301
|