|
August 15, 2020
I hope that you and your loved ones are doing well, staying healthy, and looking out for your neighbors and friends.
Since it’s Saturday, you’ll find only partial reporting on some of the metrics tracking coronavirus in Oregon. Rather than providing information about positive test results alone, over the weekend OHA combines those numbers with the relatively small number of those who are presumed to be positive based on their symptoms and close proximity to someone who has tested positive, but whose test results have not yet come back. But it still gives us a good idea of what’s going on.
Today’s number of new cases is up, but our positivity rate is way down, the result of a big increase in testing numbers. They’re so high that there may be a problem with them. We’ll know for sure on Monday.
We also don’t get hospitalization numbers over the weekend, so we won’t know what the rate of increase is till Monday. Deaths are reported, however, and today OHA reported the death of just one Oregonian.
As I’ve been doing on Saturdays for a while, I’m also taking the opportunity to look back at what’s going on in our individual counties on a week-by-week basis over the last month. You’ll see further evidence that the surge continues in some of our Eastern Oregon counties, but this analysis confirms that Oregon’s weekly numbers overall are starting to trend down.
TODAY’S CORONAVIRUS AND CORONAVIRUS RESPONSE UPDATE
-
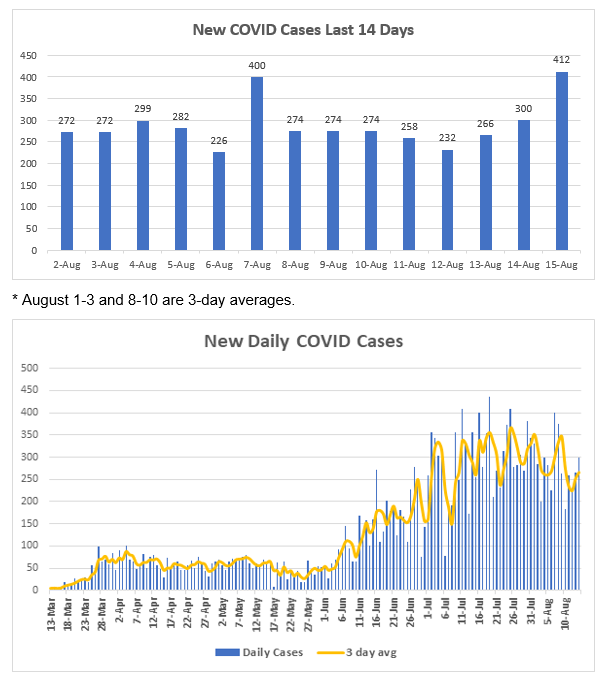
Positive Cases: OHA reports that 412 additional Oregonians have tested positive or are presumed positive (see below for definition) for COVID. (OHA does not report positive test results alone over the weekend. I’ll readjust the numbers on Monday.) The cumulative total for those testing positive and presumed positive is 23,018.
-
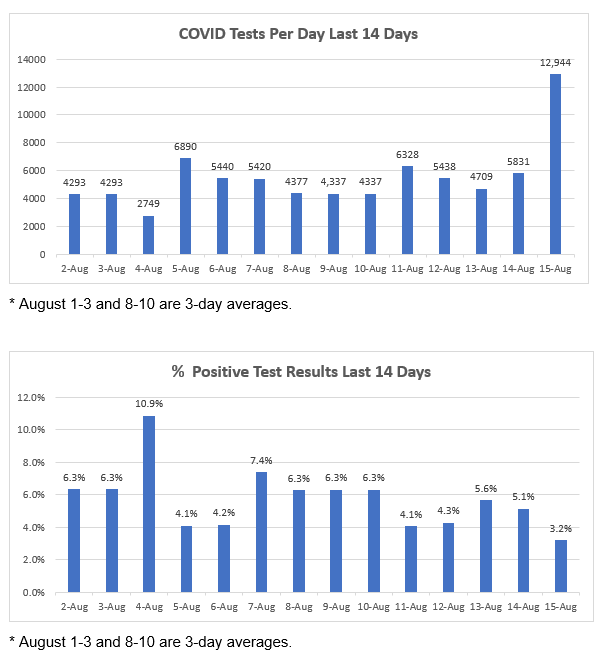
Total Tests: The number of reported tests has increased by 12,944. This is surprisingly high, and it’s a number that will likely not hold up. (OHA does not report positive test results alone over the weekend. Today’s increase in total results therefore includes presumed positives in the total results.) Since it’s the weekend, I can’t check with OHA to find out what’s going on but will do so on Monday. The cumulative total is now 484,879.
-
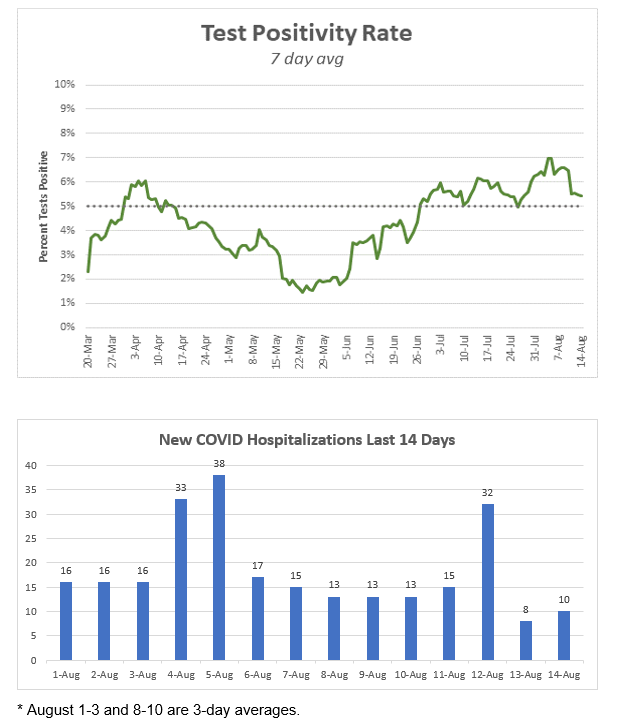
Ratio: The percentage of positive tests today is 3.2%, but it is this low because of the unusually high number of tests reported above. This number will likely be adjusted upwards on Monday. The national percentage today is 7.6%.
-
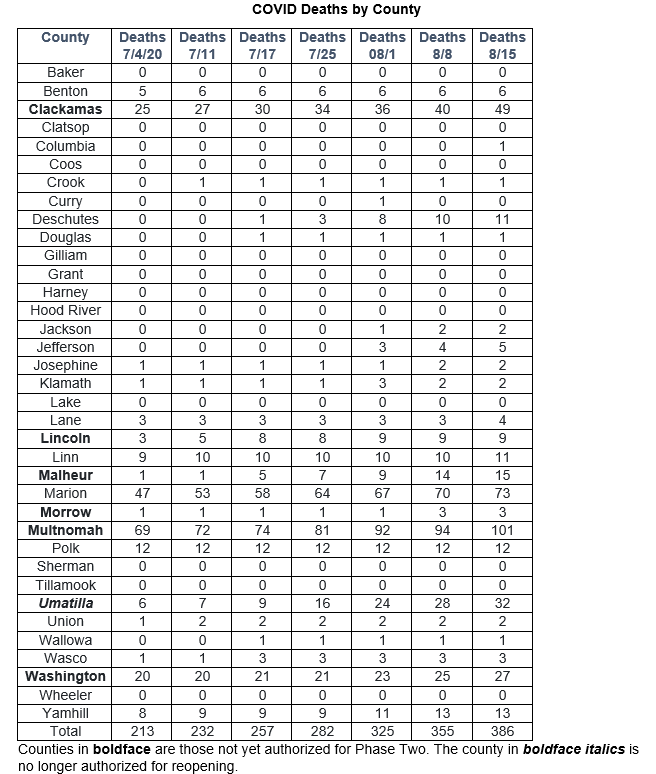
Deaths: I’m very sorry to report 1 additional death due to the coronavirus today. You can read more about the Oregonian we lost further down in the newsletter. The total number of COVID deaths in Oregon is now 386.
-
Hospitalized: OHA does not report on hospitalizations over the weekend The cumulative number of those who have been hospitalized with COVID thus remains at 1,863.
-
Presumptive Cases: OHA is including “presumptive COVID-19 cases” in its daily reports, consistent with recently amended guidance from the Centers for Disease Control and Prevention. A presumptive case is someone who does not yet have a positive PCR test result but is showing symptoms and has had close contact with a confirmed case. If they later test positive by PCR, those will be recategorized as confirmed cases.
-
Other Hospital Information: OHA DOES NOT REPORT hospitalization information over the weekend, so the numbers below are the same as Friday’s.
- Patients Currently w COVID-19 Symptoms (who may or may not have received a positive test result yet): 224 (8 fewer than yesterday). Of those, 167 have already received a positive test back.
- Available ICU Beds: 172 (13 more than yesterday)
- Other Available Beds: 643 (17 more than yesterday).
- ICU Patients w COVID-19 Symptoms: 57 (same as yesterday).
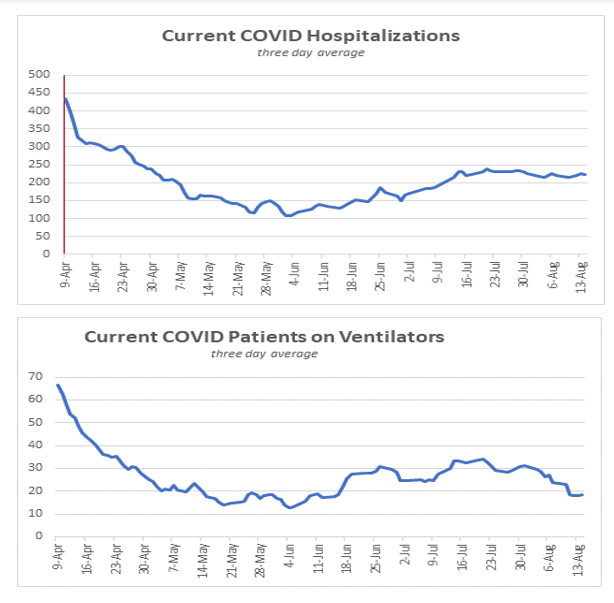
- COVID-19 Patients Currently on Ventilators: 16 (6 fewer than yesterday).
- Available Ventilators: 769 (2 fewer than yesterday).
-
Dashboards
-
Today’s National Numbers:
-
PPE: In the last 24 hours the Emergency Coordination Center has not received any additional Personal Protective Equipment. You can track the history of incoming and outgoing PPE shipments here.
-
Additional Brief Updates:
- Some good news to report. On Tuesday I wrote about a serious problem that DHS is anticipating with our SNAP (food stamps) system next month. That’s because along with a huge increase in applicants, a federal waiver freeing them from having to do in-person interviews every six months was about to run out. As I mentioned, along with other states they have applied for the emergency waiver (due to COVID) to be extended. Yesterday they received word that the waiver has been granted through the end of 2020, assuming that we are still in a declared state of emergency.
What’s Going On In the Counties?
Each Saturday I’m tracking how individual counties are doing, especially now that we’re seeing big increases in cases around the state. The key metrics that OHA is watching are the number of positive test results and the percentage of positive test results among all tests administered; the latter will be the more important way for us to see if the infection rate is increasing as a result of reopening and increased testing. (They also are looking at hospital capacity and changes in hospitalization rates, but I don’t have that information by county.)
But first, I want to reproduce the current interactive county dashboard that the OHA has on its website. It shows case counts and total testing by county since the pandemic, scaled to cases per 100,000, so that we can see how the infection is penetrating the various counties, irrespective of their population size. This is what we see as of August 14.
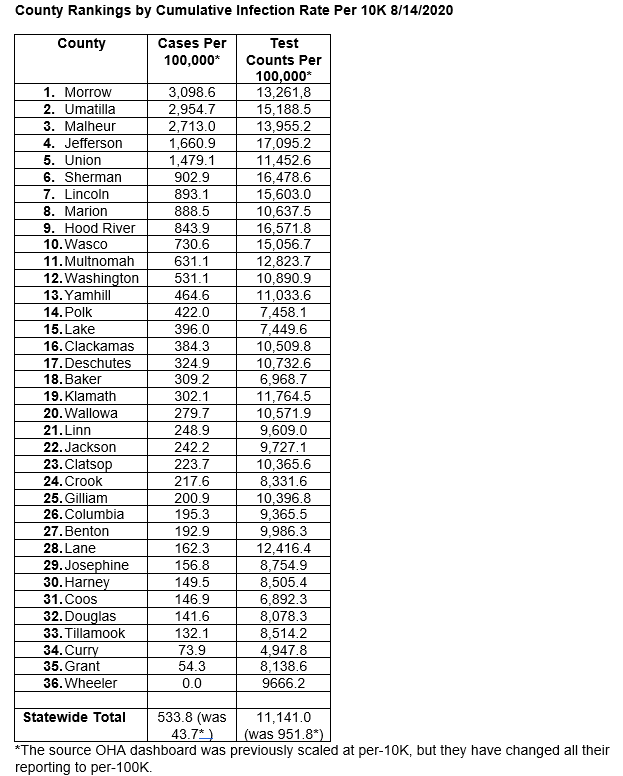
This is a useful view because it allows us to see the infection rate within each county, irrespective of their total populations. Remember, though, that these are CUMULATIVE cases since the beginning of the pandemic. If you look at the rankings, you can see the lingering effects of outbreaks at workplaces and other congregate settings that occurred a month or more ago. These lingering effects are particularly noticeable in the less populous counties.
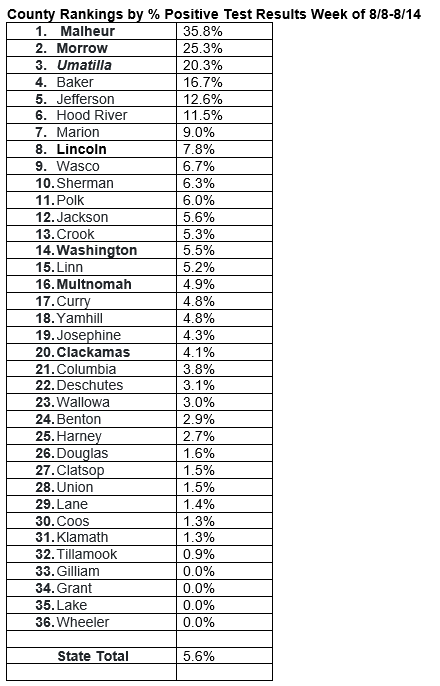
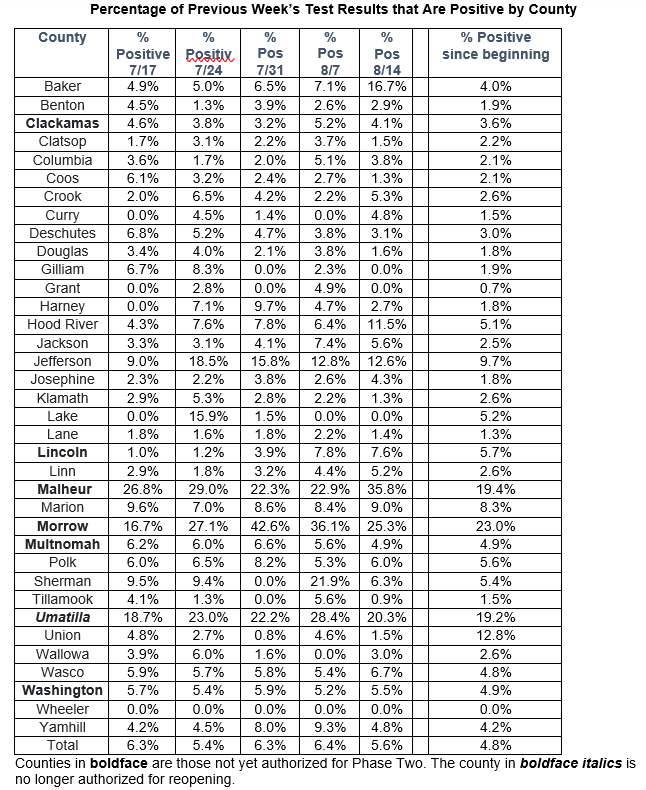
While the cumulative infection rate is an important metric to look at, I believe an even more important metric is the rate of test results coming in positive. The more you test, the lower that number should be, as you’re not just testing people with clear symptoms of COVID. Here’s a new table I’ve created that shows county rankings by the most recent week’s positivity rate. When you compare it to the previous table you’ll again see reflected in it the big improvement we’re seeing in Union County.
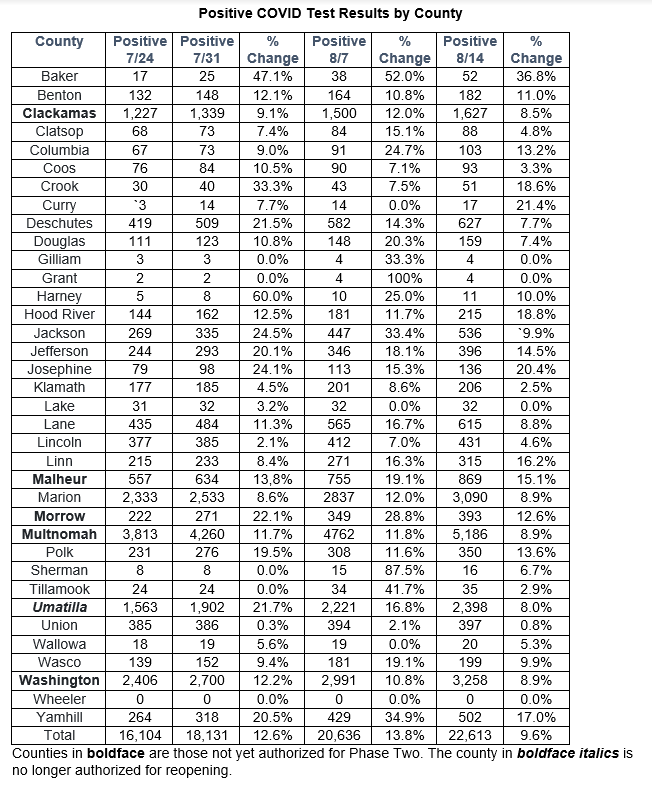
Looking at the tables below, you’ll again see increases this week both in the numbers of new cases and in the percentages of new cases on a county level.
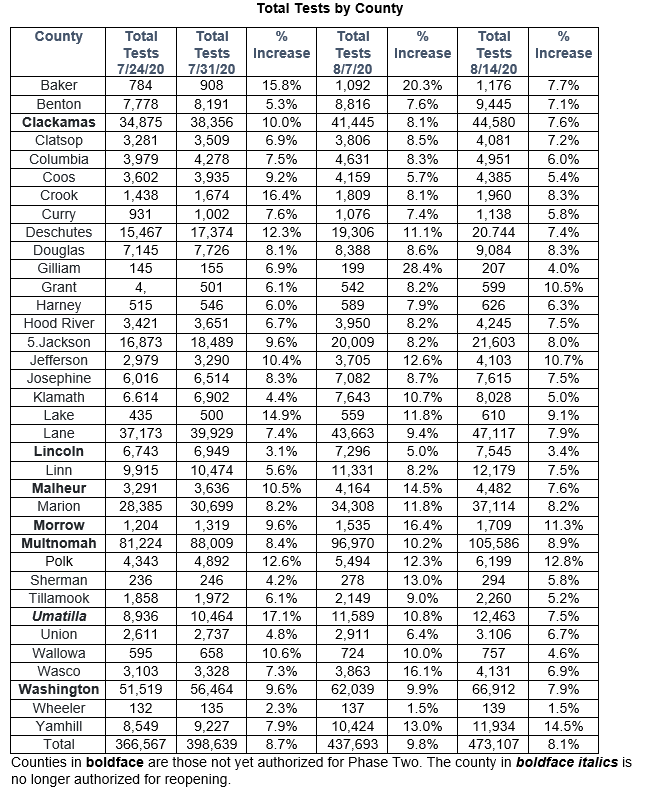
The percentage increases in positive test results may seem inordinately high when working off of a small base or when overall testing goes up rapidly in a county. Again, the more accurate way to gauge the penetration of the disease in a given county is by the percentage of positive test results each week. In order to make the current trends in positive percentages more obvious, I’m again showing you the week-over-week percentages, along with the overall percentage of positive cases for each county since the beginning of the pandemic.
Unfortunately, the proportion of positive test results for the state as a whole has gone back up again over the last week, ending the previous week’s downward movement. We’ll see what next week brings.
Where Are Today’s New Cases?
If we put together the positive test results and new “presumptive” cases reported today, the overall number of new cases is 412. Here is the breakdown by county for today:
Baker (1)
Benton (4)
Clackamas (38)
Clatsop (2)
Columbia (3)
Crook (1)
Curry (2)
Deschutes (10)
Douglas (1)
Hood River (1)
Jackson (6)
Jefferson (12)
Josephine (2)
Klamath (2)
Lane (6)
Lincoln (6)
Linn (13)
Malheur (25)
Marion (75)
Morrow (8)
Multnomah (79)
Polk (6)
Tillamook (1)
Umatilla (36)
Wasco (2)
Washington (56)
Yamhill (13)
And the Death
Oregon’s 386th COVID-19 death is a 71-year-old man in Jefferson County who tested positive on August 6 and died on August 14, at St. Charles Bend Medical Center.
Additional Graphs:
Want to See Past Newsletters?
If there was COVID-related information in a past newsletter that you want to go back to, but find you’ve deleted it, you can always go to my legislative website (www.senatordembrow.com), click on “News and Information,” and you’ll find them all there. Also, if someone forwarded you this newsletter and you’d like to get it directly, you can sign up for it there.
AND FINALLY,
Here again are some resources that you will find useful:
If the above links are not providing you with answers to your questions or directing you to the help that you need, please consider me and my office to be a resource. We’ll do our best to assist you or steer you in the right direction.
Best,
 Senator Michael Dembrow
District 23
email: Sen.MichaelDembrow@oregonlegislature.gov
web: www.senatordembrow.com
phone: 503-986-1723
mail: 900 Court St NE, S-407, Salem, OR, 97301
|